macOS High Sierra下使用brew安装支持x265的ffmpeg以及转码

使用

$ brew install ffmpeg

安装ffmpeg默认是不支持x265

使用

$ brew reinstall ffmpeg --with-x265

重新安装即可。

一般直接的H265数据流(比如从摄像头抓取的H265裸数据流保存的文件),是没办法在MacOS上直接播放的,必须进行转码。简单的转码命令如下:

$ ffmpeg -i input.h265 -c:v libx265 output.mp4

参考链接


Chrome Extension:Debugging

This tutorial introduces you to using Google Chrome's built-in Developer Tools to interactively debug an extension.

View extension information

To follow this tutorial, you need the Hello World extension that was featured inGetting Started. In this section, you'll load the extension and take a look at its information in the Extensions page.

  1. Load the Hello World extension if it isn't already running. If the extension is running, you'll see the Hello World icon  to the right of your browser's address bar.If the Hello World extension isn't already running, find the extension files and load them. If you don't have a handy copy of the files, extract them from this ZIP file. See Getting Started if you need instructions for loading the extension.
  2. Go to the Extensions page (chrome://extensions), and make sure the page is in Developer mode.
  3. Look at the Hello World extension's information on that page. You can see details such as the extension's name, description, and ID.

Inspect the popup

As long as your browser is in Developer mode, it's easy to inspect popups.

  1. Go to the Extensions page (chrome://extensions), and make sure Developer mode is still enabled. The Extensions page doesn't need to be open for the following to work. The browser remembers the setting, even when the page isn't shown.
  2. Right-click the Hello World icon  and choose the Inspect popup menu item. The popup appears, and a Developer Tools window like the following should display the code for popup.html.The popup remains open as long as the Developer Tools window does.
  3. If the Scripts button isn't already selected, click it.
  4. Click the console button (second from left, at the bottom of the Developer Tools window) so that you can see both the code and the console.

Use the debugger

In this section, you'll follow the execution of the popup page as it adds images to itself.
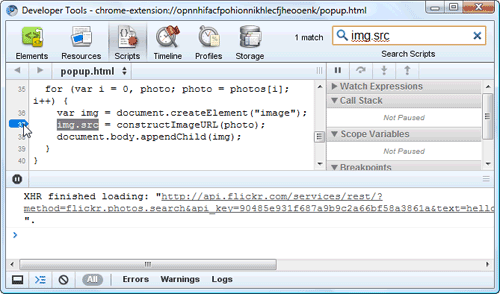
    1. Set a breakpoint inside the image-adding loop by searching for the string img.src and clicking the number of the line where it occurs (for example, 37):
    2. Make sure you can see the popup.html tab. It should show 20 "hello world" images.
    3. At the console prompt, reload the popup page by entering location.reload(true):
      > location.reload(true)

      The popup page goes blank as it begins to reload, and its execution stops at line 37.

    4. In the upper right part of the tools window, you should see the local scope variables. This section shows the current values of all variables in the current scope. For example, in the following screenshot the value of i is 0, and photos is a node list that contains at least a few elements. (In fact, it contains 20 elements at indexes 0 through 19, each one representing a photo.)
    5. Click the play/pause button (near the top right of the Developer Tools window) to go through the image-processing loop a single time. Each time you click that button, the value of i increments and another icon appears in the popup page. For example, when i is 10, the popup page looks something like this:
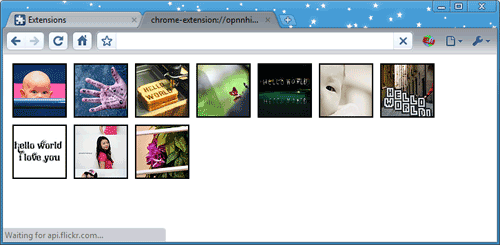
  1. Use the buttons next to the play/pause button to step over, into, and out of function calls. To let the page finish loading, click line 37 to disable the breakpoint, and then press play/pause to continue execution.

Summary

This tutorial demonstrated some techniques you can use to debug your extensions:

  • Find your extension's ID and links to its pages in the Extensions page (chrome://extensions).
  • View hard-to-reach pages (and any other file in your extension) using chrome-extension://extensionId/filename.
  • Use Developer Tools to inspect and step through a page's JavaScript code.
  • Reload the currently inspected page from the console using location.reload(true).

Now what?

Now that you've been introduced to debugging, here are suggestions for what to do next:

  • Watch the extensions video Developing and Debugging.
  • Try installing and inspecting other extensions, such as the samples.
  • Try using widely available debugging APIs such as console.log() and console.error() in your extension's JavaScript code. Example: console.log("Hello, world!")
  • Follow the Developer Tools tutorial, explore the Developer Tools site, and watch some video tutorials.

For more ideas, see the Now what? section of Getting Started.

CMake如何编译CUDA(.cu)源文件

现在的项目,如果需要用到计算加速,NvidiaCUDA往往是首选。那么如何在CMake中编译写好的CUDA源代码,可以参考如下。

首先使用FIND_PACKAGE找到已经安装的CUDA,此时需要配置的环境变量等,应该已经自动配置完成了

SET(CUDA_VERSION 8.0)
FIND_PACKAGE(CUDA ${CUDA_VERSION} REQUIRED)
STRING (TOLOWER ${CMAKE_SYSTEM_NAME} LOWER_SYSTEM_NAME)
SET(CUDA_TARGET_INCLUDE  ${CUDA_TOOLKIT_ROOT_DIR}-${CUDA_VERSION}/targets/${CMAKE_HOST_SYSTEM_PROCESSOR}-${LOWER_SYSTEM_NAME}/include)

接下来,使用CUDA_ADD_LIBRARY取代原来的ADD_LIBRARY,如下:

CUDA_ADD_LIBRARY(mylib SHARED
    file1.cpp
    file2.cu
    file3.cpp
    OPTIONS -arch sm_20
)

TARGET_LINK_LIBRARIES(mylib ${CUDA_LIBRARIES})

如果是可执行程序,请使用CUDA_ADD_EXECUTABLE取代ADD_EXECUTABLE

参考链接


CMake: how to add cuda to existing project