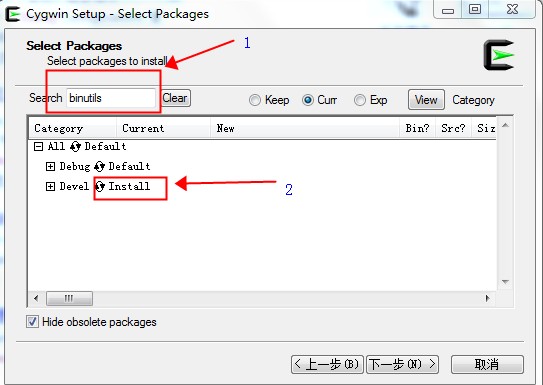
最近在Windows下面编写NDK应用,在检查编译完成后的so文件的时候,发现,objdump,readelf,nm,ldd等命令不能在默认安装的Cygwin中使用。解决方法是,下载Cygwin的安装包,然后点击安装,从选择包里面增加 binutils包,如下图所示:(注意,只选择Devel版本即可,正常情况下我们一般不会需要携带调试信息的版本)
分类: Windows
fatal error C1189: #error : The C++ Standard Library forbids macroizing keywords. Enable warning C4005 to find the forbidden macro.
最近在使用 VS2015 编译以前用VS2008的项目的时候,提示错误:fatal error C1189: #error : The C++ Standard Library forbids macroizing keywords. Enable warning C4005 to find the forbidden macro.
解决方法:在项目的“预处理器定义”中增加 "_XKEYCHECK_H"
warning C4743: “const std::ios_base::failure::`vftable'”有不同的大小: 16 和 12 字节
最近在使用VS2013进行静态库链接的时候,发现在最后链接的时候,编译器报告如下警告
1 2 3 4 |
4>LINK : warning C4743: “const std::system_error::`vftable'”在“aaa.cc”和“bbb.cpp”中具有不同的大小: 16 和 12 字节 4>LINK : warning C4743: “const std::_System_error::`vftable'”在“ccc.cc”和“ddd.cpp”中具有不同的大小: 16 和 12 字节 4>LINK : warning C4743: “const std::ios_base::failure::`vftable'”在“eee.cc”和“fff.cpp”中具有不同的大小: 16 和 12 字节 4>LINK : warning C4743: “const std::runtime_error::`vftable'”在“xxx.cc”和“yyy.cpp”中具有不同的大小: 16 和 12 字节 |
尽管这个是个警告,但是由于涉及到vftable 的问题,这个问题会导致对象指针之间相互赋值的时候导致内存布局混乱,非常可能导致严重的问题。因此这个警告的危险级别甚至比错误的还要严重,绝不能简单的忽略这个问题。
研究了很久,发现,在Debug版本上面是没有问题的,但是Release版本上面必然出现该问题。并且当设置VC++ 的 “工程属性->配置属性->C/C++->优化->全程序优化”为 “否”的时候,也是可以无警告链接通过的。但是却会导致我们的工程损失更多的优化,降低运行效率。
这个问题产生的原因是一个宏引起的,这个宏就是 “_HAS_EXCEPTIONS=0” 。这个宏控制了STL对于异常的处理流程,影响着typeinfo,system_error 等几个文件中对于VC 运行时库的链接选择,要么链接libcmt.lib,要么链接msvcrt.lib。比较不凑巧的是,微软在实现这两个库的时候,其中一个比另外一个多了一个虚函数。(这种情况不应该发生,但是确实发生了!)
因此,如果我们的LIB工程定义了“_HAS_EXCEPTIONS=0” ,那么所有使用我们这个LIB的项目,都要定义这个宏。
对于简单的项目,只要都定义“_HAS_EXCEPTIONS=0” 就可以解决问题。但是对于复杂的工程,尤其是依赖了大量的第三方的已经编译过的,没有源代码的LIB项目来说,只能是采用妥协的办法,所有的工程都取消这个宏的定义,使得两者的内存布局相同。毕竟,稳定性是第一需求。
Windows机器上程序崩溃dump(UMDF Crash Dump)
最近接到用户的投诉,在Windows 7 32位的机器上,UMDF驱动频繁崩溃,关键是SetUnhandledExceptionFilter 设置的异常过滤竟然一丁点用都没有,查询了半天,才注意到UMDF框架把UnhandledException接管了,你完全是无力反抗。
然后去MSDN上查询,根据Determining Why the Reflector Terminated the Host Process微软文档,WER会在“%windir%\system32\LogFiles\WUDF”目录下面生成DUMP文件,测试之后发现,是否生成完全依赖WER的心情,捣鼓到后来,干脆完全不生成DUMP文件了,另外他偶尔生成的也都是MiniDump ,作用有限。“Users\All Users\Microsoft\Windows\WER\ReportQueue”目录下面的报告数据,也是时有时无,阴晴不定。
继续Google,微软文档 Collecting User-Mode Dumps 设置如下的注册表
1 2 3 4 5 6 7 8 9 10 11 12 13 14 15 16 |
Windows Registry Editor Version 5.00 [HKEY_LOCAL_MACHINE\SOFTWARE\Microsoft\Windows\Windows Error Reporting\LocalDumps] "DumpType"=dword:00000001 "DumpCount"=dword:0000000A "DumpFolder"="D:\\Temp" [HKEY_LOCAL_MACHINE\SOFTWARE\Wow6432Node\Microsoft\Windows\Windows Error Reporting\LocalDumps] "DumpType"=dword:00000001 "DumpCount"=dword:0000000A "DumpFolder"="D:\\Temp" [HKEY_CURRENT_USER\Software\Microsoft\Windows\Windows Error Reporting\LocalDumps] "DumpType"=dword:00000001 "DumpCount"=dword:0000000A "DumpFolder"="D:\\Temp" |
这样设置之后,正常的应用都可以在D:\Temp 下面生成崩溃记录,但是WUDFHost.exe 就是不能生成崩溃DUMP,貌似是WUDFHost.exe 用其他低权限用户账户运行,导致没办法生成转储文件。
继续Google,ProcDump进入视野,着实是个好的工具软件,非常好用。于是写了个批处理文件来跟踪WUDFHost.exe的异常。
1 |
procdump -ma -e WUDFHost.exe |
应用崩溃的时候,会在当前目录下面生产对应的.dmp文件。
下面为简单的用法例子
1 2 3 4 5 6 7 8 9 10 11 12 13 14 15 16 17 18 19 20 21 22 23 24 25 26 27 28 29 30 31 32 33 34 35 36 37 38 39 40 41 42 43 44 45 46 47 48 49 50 51 52 53 54 55 56 57 58 59 60 61 62 63 64 65 66 67 68 69 70 71 72 73 74 75 76 77 78 79 80 81 82 83 84 85 |
Using ProcDump usage: procdump [-a] [[-c|-cl CPU usage] [-u] [-s seconds]] [-n exceeds] [-e [1 [-b]] [-f <filter,...>] [-g] [-h] [-l] [-m|-ml commit usage] [-ma | -mp] [-o] [-p|-pl counter threshold] [-r] [-t] [-d <callback DLL>] [-64] <[-w] <process name or service name or PID> [dump file] | -i <dump file> | -u | -x <dump file> <image file> [arguments] >] [-? [ -e] -a Avoid outage. Requires -r. If the trigger will cause the target to suspend for a prolonged time due to an exceeded concurrent dump limit, the trigger will be skipped. -b Treat debug breakpoints as exceptions (otherwise ignore them). -c CPU threshold at which to create a dump of the process. -cl CPU threshold below which to create a dump of the process. -d Invoke the minidump callback routine named MiniDumpCallbackRoutine of the specified DLL. -e Write a dump when the process encounters an unhandled exception. Include the 1 to create dump on first chance exceptions. -f Filter the first chance exceptions. Wildcards (*) are supported. To just display the names without dumping, use a blank ("") filter. -g Run as a native debugger in a managed process (no interop). -h Write dump if process has a hung window (does not respond to window messages for at least 5 seconds). -i Install ProcDump as the AeDebug postmortem debugger. Only -ma, -mp, -d and -r are supported as additional options. -l Display the debug logging of the process. -m Memory commit threshold in MB at which to create a dump. -ma Write a dump file with all process memory. The default dump format only includes thread and handle information. -ml Trigger when memory commit drops below specified MB value. -mp Write a dump file with thread and handle information, and all read/write process memory. To minimize dump size, memory areas larger than 512MB are searched for, and if found, the largest area is excluded. A memory area is the collection of same sized memory allocation areas. The removal of this (cache) memory reduces Exchange and SQL Server dumps by over 90%. -n Number of dumps to write before exiting. -o Overwrite an existing dump file. -p Trigger on the specified performance counter when the threshold is exceeded. Note: to specify a process counter when there are multiple instances of the process running, use the process ID with the following syntax: "\Process(<name>_<pid>)\counter" -pl Trigger when performance counter falls below the specified value. -r Dump using a clone. Concurrent limit is optional (default 1, max 5). CAUTION: a high concurrency value may impact system performance. Windows 7 : Uses Reflection. OS doesn't support -e. Windows 8.0 : Uses Reflection. OS doesn't support -e. Windows 8.1+: Uses PSS. All trigger types are supported. -s Consecutive seconds before dump is written (default is 10). -t Write a dump when the process terminates. -u Treat CPU usage relative to a single core (used with -c). As the only option, Uninstalls ProcDump as the postmortem debugger. -w Wait for the specified process to launch if it's not running. -x Launch the specified image with optional arguments. If it is a Store Application or Package, ProcDump will start on the next activation (only). -64 By default ProcDump will capture a 32-bit dump of a 32-bit process when running on 64-bit Windows. This option overrides to create a 64-bit dump. Only use for WOW64 subsystem debugging. -? Use -? -e to see example command lines. If you omit the dump file name, it defaults to <processname>_<datetime>.dmp. Use the -accepteula command line option to automatically accept the Sysinternals license agreement. Examples Write a mini dump of a process named 'notepad' (only one match can exist): C:\>procdump notepad Write a full dump of a process with PID '4572': C:\>procdump -ma 4572 Write 3 mini dumps 5 seconds apart of a process named 'notepad': C:\>procdump -s 5 -n 3 notepad Write up to 3 mini dumps of a process named 'consume' when it exceeds 20% CPU usage for five seconds: C:\>procdump -c 20 -s 5 -n 3 consume Write a mini dump for a process named 'hang.exe' when one of it's Windows is unresponsive for more than 5 seconds: C:\>procdump -h hang.exe hungwindow.dmp Write a mini dump of a process named 'outlook' when total system CPU usage exceeds 20% for 10 seconds: C:\>procdump outlook -p "\Processor(_Total)\% Processor Time" 20 Write a full dump of a process named 'outlook' when Outlook's handle count exceeds 10,000: C:\>procdump -ma outlook -p "\Process(Outlook)\Handle Count" 10000 Write a MiniPlus dump of the Microsoft Exchange Information Store when it has an unhandled exception: C:\>procdump -mp -e store.exe Display without writing a dump, the exception codes/names of w3wp.exe: C:\>procdump -e 1 -f "" w3wp.exe Write a mini dump of w3wp.exe if an exception's code/name contains 'NotFound': C:\>procdump -e 1 -f NotFound w3wp.exe Launch a process and then monitor it for exceptions: C:\>procdump -e 1 -f "" -x c:\dumps consume.exe Register for launch, and attempt to activate, a modern 'application'. A new ProcDump instance will start when it activated to monitor for exceptions: C:\>procdump -e 1 -f "" -x c:\dumps Microsoft.BingMaps_8wekyb3d8bbwe!AppexMaps Register for launch of a modern 'package'. A new ProcDump instance will start when it is (manually) activated to monitor for exceptions: C:\>procdump -e 1 -f "" -x c:\dumps Microsoft.BingMaps_1.2.0.136_x64__8wekyb3d8bbwe Register as the Just-in-Time (AeDebug) debugger. Makes full dumps in c:\dumps. C:\>procdump -ma -i c:\dumps See a list of example command lines (the examples are listed above): C:\>procdump -? -e |
VisualSVNServer Service failed to start
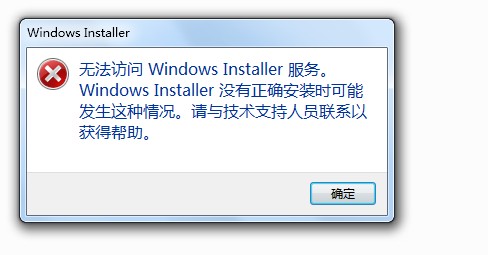
解决Win7“无法访问Windows Installer服务。Windows Installer没有正确安装时可能发生这种情况...”
今天在卸载一个软件时,发生错误,提示信息如下:
无法访问Windows Installer服务。Windows Installer没有正确安装时可能发生这种情况...
在网上找了下原因,都知道是Windows Installer服务出现了问题,如没有启动它呀,
启动不了Windows Installer呀之类的...却没有给出一个有用的解决方法。
好不容易知道微软提供了一个 Windows Fix it 服务,网址如下
http://support2.microsoft.com/default.aspx?scid=kb;%5BLN%5D;290301
或者
http://support2.microsoft.com/fixit/zh-cn
或者
Fix problems that block programs from being installed or removed
经过一番折腾,搞定!
目前(2018.03.14)貌似微软关闭了这个网站,可以在本站下载Microsoft Fix it 51015。
这个工具微软的下载地址为http://download.microsoft.com/download/D/9/7/D97359C4-B5EA-40C7-9991-3EEF14D4848F/MicrosoftFixit51015.msi
如何在VS2010 IE11 下调试BHO控件
用Visual Studio 2008开发IE BHO (浏览器帮助对象)之一
BHO 通常并不提供其自身的任何用户界面 (UI)。它们而是通过在后台响应浏览器事件和用户输入数据来发挥作用。例如,BHO 可以拦截弹出窗口、自动填充窗体或为鼠标手势添加支持。
有一种常见误解认为工具栏扩展项需要 BHO.但如果将 BHO 与工具栏配合使用,则可以实现更丰富的用户体验。(关于IE工具栏的编程,在另一篇文章中说明).
BHO 的生命周期与它所交互的浏览器实例的生命周期相等。在 IE 6 和早期版本中,这意味着要为每个新的顶层窗口创建(和销毁)一个新 BHO。在IE 7中则是为每个选项卡都创建和销毁一个新 BHO。
BHO 必须实现 IObjectWithSite 接口, 该接口提供了两个方法GetSite和SetSite。根据MSDN的说明:
1 2 3 |
GetSite: Gets the last site set with IObjectWithSite::SetSite. If there is no known site, the object returns a failure code. SetSite: Provides the site's IUnknown pointer to the object. |
我们主要是对后者进行调用,此方法方便了与 Internet Explorer 的初始通信,并会在其将要释放时通知 BHO。我们实现此接口,然后将 BHO 的 CLSID 添加到注册表中,就可以创建一个简单的浏览器扩展。过程如下:
1. 在Visual Studio中,选择VC++中的ATL项目, 创建一个新的项目MySolutionPlugin, 在随后的向导中,确认Server Type是Dll, Visual Studio会为我们创建程序的模板.
2. 为该项目添加我们的程序主体, (不熟悉visual studio的同学在资源浏览器里的右键菜单里选 add-->class, 可别选到New Item), 类型选ATL Simple Object , short name命名为RayBHO,各项属性如下:
a) “线程模型” ---“Apartment”
b) “聚合”---“否”
c) “接口”---“双重”
d) “支持”---勾上“IobjectWithSite”。
具体的含义请参考MSDN.
一般来说,Internet Explorer 至少调用SetSite方法两次: 一次用于建立连接,另一次则是在浏览器退出时。我们 BHO 中的 SetSite 实现将执行以下操作:
•存储对站点的引用。在初始化期间,浏览器将 IUnknown 指针传递给顶层 WebBrowser 控件,然后 BHO 将对它的引用存储在一个专用成员变量中。
•释放目前被占用的站点指针。Internet Explorer 传递 NULL 时,BHO 必须释放所有接口引用并且断开与浏览器的连接。
要实现SetSite,我们需手工在添加一个public的方法:
1 |
STDMETHOD(SetSite)(IUnknown * pUnkSite); |
STDMETHOD 宏是将方法标记为虚方法并且确保其具有适用于公共 COM 接口的调用约定的一个ATL 约定, 它有助于区分 COM 接口和该类中可能存在的其他公共方法。其实现成员方法时应相应使用 STDMETHODIMP 宏。同时我们需要声明一个私有变量来保存Browser的指针"
1 |
CComPtr<IWebBrowser2> m_spWebBrowser;//保存Browser指针的 |
私有变量
然后是SetSite的实现
1 2 3 4 5 6 7 8 9 10 11 12 13 14 15 |
STDMETHODIMP CRayBHO::SetSite(IUnknown*pUnkSite) { if(pUnkSite!=NULL) { //缓存指向IWebBrowser2的指针。 pUnkSite->QueryInterface(IID_IWebBrowser2,(void**)&m_spWebBrowser); } else { //在此释放缓存的指针和其他资源。 m_spWebBrowser.Release(); } //返回基类实现 return IObjectWithSiteImpl::SetSite(pUnkSite); } |
从上面的介绍我们知道, 初始化期间,浏览器将传递一个对其顶层 IWebBrowser2 接口(我们对其进行缓存处理)的引用。浏览器关闭时将传递 NULL,为避免内存泄漏和循环引用计数,此时释放所有指针和资源非常重要。最后,我们调用基类实现以便继续执行接口合约的其余部分。
加载DLL 后,系统将通过 DLL_PROCESS_ATTACH 通知调用 DllMain 函数。由于 Internet Explorer 大量使用多线程,因此,对 DllMain 的频繁的 DLL_THREAD_ATTACH 和 DLL_THREAD_DETACH 通知会降低扩展和浏览器进程的整体性能。
如果BHO 不需要线程级的跟踪,我们可以在 DLL_PROCESS_ATTACH 通知期间调用 DisableThreadLibraryCalls 以避免新线程通知的额外开销。修改DllMain.cpp 中的DllMain函数:
1 2 3 4 5 6 7 8 |
extern "C" BOOL WINAPI DllMain(HINSTANCE hInstance, DWORD dwReason, LPVOID lpReserved) { if(dwReason==DLL_PROCESS_ATTACH) { DisableThreadLibraryCalls(hInstance); } return _AtlModule.DllMain(dwReason,lpReserved); } |
要使BHO工作,我们还需要把BHO 的 CLSID 添加到注册表中。此条目会将 此DLL 标记为浏览器帮助程序对象,并使 Internet Explorer 在启动时加载 BHO。我们可以在MySolutionPlugin.idl中找到该BHO的CLSID.幸运的,Visual Studio会帮助我们实现这些, 你看到:
1 2 3 4 5 |
importlib("stdole2.tlb"); [ uuid(057F3E68-6C2E-40A5-A641-E8CF9D6766F3), helpstring("RayBHO Class") ] |
您的机器的CLSID可能有所不同, 接着打开RayBHO.rgs文件,添加入:
1 2 3 4 5 6 7 8 9 10 11 12 13 14 15 16 17 18 19 20 21 22 23 24 25 |
HKLM { NoRemove SOFTWARE { NoRemove Microsoft { NoRemove Windows { NoRemove CurrentVersion { NoRemove Explorer { NoRemove 'Browser Helper Objects' { ForceRemove {057F3E68-6C2E-40A5-A641-E8CF9D6766F3} = s 'RayBHO Class' { val NoExplorer = d '1' } } } } } } } } |
这一段是为了在注册表里添加一个双字节的NoExplorer=1的键,不让Windows Explorer加载该BHO,因此该BHO只能在ie中运行.
注意,这里的UUID字段跟MySolutionPlugin.idl 中的是一致的。
你可以编译这个BHO. 如果一切正常, 你可以在IE的管理加载项里看到这个BHO.
如果不幸报错: 该BHO无法被注册,根据我的经验,原因大概有2类,可以依次检查
1. 你是否有管理员权限以修改注册表,如不是管理员身份,可以在菜单上右击Microsoft Visual studio 2008,从右键菜单中选择"运行方式"...
2. 你的注册表条目语法是否正确,或者含有非法字符.
Windows下Mingw的复制粘贴
调试UMDF驱动
相对于调试运行在最高特权级的WDM、KMDF驱动,调试运行在ring3的UMDF驱动难度大为降低,不需要双机调试,我们可以像调试普通应用程序和服务一样在一台电脑上完成。
调试方法:
- 编译好需要调试的驱动(包括安装用的inf等),连接硬件,把需要调试的驱动安装上。然后断开硬件连接(对于USB设备来说直接拔出就可以了)。
- 启动WinDBG,设置好符号路径,特别是被调试驱动的符号。详细设置可以参考Debugging Tools的文档。
- 运 行regedit,打开
1HKEY_LOCAL_MACHINE\SOFTWARE\Microsoft\Windows NT\CurrentVersion\WUDF\Services\{193a1820-d9ac-4997-8c55-be817523f6aa}
如果之前从 未调试过UMDF驱动,会发现HostProcessDbgBreakOnDriverLoad键值为0,这个键值的含义是延迟多少秒加载驱动对象。我们 把它修改为15秒(十六进制0xF,如果手慢可以改得更大)。注意这个键值不影响DllMain,如果要调试DllMain,请修改 HostProcessDbgBreakOnStart。 - 插入硬件,并且在15秒内使用WinDBG的Attach to Process(快捷键是F6),找到UMDFHost.exe,attach即可。注意如果系统有多个使用UMDF驱动的硬件,就会有多个 UMDFHost.exe进程,为了不致混淆,请提前移除不用的硬件。
- 完成调试后,请恢复注册表(将延迟修改为0),以免正常硬件的驱动加载被延迟。
链接 http://hyperiris.blog.163.com/blog/static/180840059201026477127/