macOS Sierra(10.12.3)上尝试下载Nvidia的CUDA,但是由于国内网络问题,导致使用浏览器下载的时候,不仅慢,而且还经常失败,基本上没办法下载成功。尝试使用迅雷的话,如果不是会员,貌似也没有太多的用处。另外一个比较麻烦的问题是,Nvidia下载服务器,随着下载时间的延长,会强制限制下载速度,导致越来越慢,到最后只有若干KB的速度。
继续阅读macOS Sierra (10.12.3)利用aria2解决CUDA下载失败问题
Hollow-Expected class sun.util.calendar.BaseCalendar$Date but object was class java.util.Date
ObjectMapper写入一个数据,包含一个java.util.Date成员,报Expected class sun.util.calendar.BaseCalendar$Date but object was class java.util.Date错误。
这是hollow v2.1.0以下的一个bug,详见:
https://github.com/Netflix/hollow/issues/13
dkoszewnik commented on 31 Jan
| Thanks very much for the report! I verified the issue and released a fix in v2.1.1. |
有趣的是,将hollow替换成2.1.1,还是报这个错误,替换成2.2.1就好了
这句I verified the issue and released a fix in v2.1.1.像极了研发的口头禅‘下个版本修复’,承包了我一上午的笑点。
Caffe用训练好的caffemodel来进行分类
caffe程序自带有一张小猫图片,存放路径为caffe根目录下的examples/images/cat.jpg, 如果我们想用一个训练好的caffemodel来对这张图片进行分类,那该怎么办呢? 如果不用这张小猫图片,换一张别的图片,又该怎么办呢?如果学会了小猫图片的分类,那么换成其它图片,程序实际上是一样的。
开发caffe的贾大牛团队,利用imagenet图片和caffenet模型训练好了一个caffemodel,供大家下载。要进行图片的分类,这个caffemodel是最好不过的了。所以,不管是用C++来进行分类,还是用python接口来分类,我们都应该准备这样三个文件:
1. caffemodel文件
可以直接在浏览器里输入地址下载,也可以运行脚本文件下载。下载地址:http://dl.caffe.berkeleyvision.org/bvlc_reference_caffenet.caffemodel
文件名称为:bvlc_reference_caffenet.caffemodel,文件大小为230M左右,为了代码的统一,将这个caffemodel文件下载到caffe根目录下的models/bvlc_reference_caffenet/文件夹下面。也可以运行脚本文件进行下载:
|
1 |
$ ./scripts/download_model_binary.py models/bvlc_reference_caffenet |
2. 均值文件
有了caffemodel文件,就需要对应的均值文件,在测试阶段,需要把测试数据减去均值。这个文件我们用脚本来下载,在caffe根目录下执行:
|
1 |
$ sh ./data/ilsvrc12/get_ilsvrc_aux.sh |
执行并下载后,均值文件放在 data/ilsvrc12/ 文件夹里。
3. synset_words.txt文件
在调用脚本文件下载均值的时候,这个文件也一并下载好了。里面放的是1000个类的名称。
数据准备好了,我们就可以开始分类了,我们给大家提供两个版本的分类方法:
一. C++方法
在caffe根目录下的examples/cpp-classification/文件夹下面,有个classification.cpp文件,就是用来分类的。当然编译后,放在/build/examples/cpp_classification/下面
我们就直接运行命令:
|
1 2 3 4 5 6 |
# sudo ./build/examples/cpp_classification/classification.bin \ models/bvlc_reference_caffenet/deploy.prototxt \ models/bvlc_reference_caffenet/bvlc_reference_caffenet.caffemodel \ data/ilsvrc12/imagenet_mean.binaryproto \ data/ilsvrc12/synset_words.txt \ examples/images/cat.jpg |
命令很长,用了很多的\符号来换行。可以看出,从第二行开始就是参数,每行一个,共需要4个参数
运行成功后,输出top-5结果:
|
1 2 3 4 5 6 |
---------- Prediction for examples/images/cat.jpg ---------- 0.3134 - "n02123045 tabby, tabby cat" 0.2380 - "n02123159 tiger cat" 0.1235 - "n02124075 Egyptian cat" 0.1003 - "n02119022 red fox, Vulpes vulpes" 0.0715 - "n02127052 lynx, catamount" |
即有0.3134的概率为tabby cat, 有0.2380的概率为tiger cat ......
二. python方法
python接口可以使用jupyter notebook来进行可视化操作,因此推荐使用这种方法。
在这里我就不用可视化了,编写一个py文件,命名为py-classify.py
|
1 2 3 4 5 6 7 8 9 10 11 12 13 14 15 16 17 18 19 20 21 22 23 24 25 26 27 28 29 30 31 32 33 34 |
#coding=utf-8 #加载必要的库 import numpy as np import sys,os #设置当前目录 caffe_root = '/home/xxx/caffe/' sys.path.insert(0, caffe_root + 'python') import caffe os.chdir(caffe_root) net_file=caffe_root + 'models/bvlc_reference_caffenet/deploy.prototxt' caffe_model=caffe_root + 'models/bvlc_reference_caffenet/bvlc_reference_caffenet.caffemodel' mean_file=caffe_root + 'python/caffe/imagenet/ilsvrc_2012_mean.npy' net = caffe.Net(net_file,caffe_model,caffe.TEST) transformer = caffe.io.Transformer({'data': net.blobs['data'].data.shape}) transformer.set_transpose('data', (2,0,1)) transformer.set_mean('data', np.load(mean_file).mean(1).mean(1)) transformer.set_raw_scale('data', 255) transformer.set_channel_swap('data', (2,1,0)) im=caffe.io.load_image(caffe_root+'examples/images/cat.jpg') net.blobs['data'].data[...] = transformer.preprocess('data',im) out = net.forward() imagenet_labels_filename = caffe_root + 'data/ilsvrc12/synset_words.txt' labels = np.loadtxt(imagenet_labels_filename, str, delimiter='\t') top_k = net.blobs['prob'].data[0].flatten().argsort()[-1:-6:-1] for i in np.arange(top_k.size): print top_k[i], labels[top_k[i]] |
对于macOS Sierra (10.12.3)来说,需要设置python环境,(参考源代码中的python/requirements.txt),如下:
|
1 2 3 4 5 6 7 8 9 10 11 12 13 14 15 16 17 18 19 20 21 22 23 |
#切换到我们自己安装的python版本,系统自带版本会在安装插件时候由于权限问题而失败 $ brew install python #安装必要的python包 $ sudo pip install Cython $ sudo pip install numpy $ sudo pip install scipy #只能安装编译好的包,源代码安装失败 $ sudo pip install scikit-image $ sudo pip install matplotlib $ sudo pip install ipython $ sudo pip install h5py $ sudo pip install leveldb $ sudo pip install networkx $ sudo pip install nose $ sudo pip install pandas $ sudo pip install python-dateutil $ sudo pip install protobuf $ sudo pip install python-gflags $ sudo pip install pyyaml $ sudo pip install Pillow $ sudo pip install six |
执行这个文件,输出:
|
1 2 3 4 5 |
281 n02123045 tabby, tabby cat 282 n02123159 tiger cat 285 n02124075 Egyptian cat 277 n02119022 red fox, Vulpes vulpes 287 n02127052 lynx, catamount |
caffe开发团队实际上也编写了一个python版本的分类文件,路径为 python/classify.py
运行这个文件必需两个参数,一个输入图片文件,一个输出结果文件。而且运行必须在python目录下。假设当前目录是caffe根目录,则运行:
|
1 2 |
$ cd python $ sudo python classify.py ../examples/images/cat.jpg result.npy |
分类的结果保存为当前目录下的result.npy文件里面,是看不见的。而且这个文件有错误,运行的时候,会提示
|
1 |
Mean shape incompatible with input shape |
的错误。因此,要使用这个文件,我们还得进行修改:
1.修改均值计算:
定位到
|
1 |
mean = np.load(args.mean_file) |
这一行,在下面加上一行:
|
1 |
mean=mean.mean(1).mean(1) |
则可以解决报错的问题。
2.修改文件,使得结果显示在命令行下:
定位到
|
1 2 3 4 |
# Classify. start = time.time() predictions = classifier.predict(inputs, not args.center_only) print("Done in %.2f s." % (time.time() - start)) |
这个地方,在后面加上几行,如下所示:
|
1 2 3 4 5 6 7 8 9 |
# Classify. start = time.time() predictions = classifier.predict(inputs, not args.center_only) print("Done in %.2f s." % (time.time() - start)) imagenet_labels_filename = '../data/ilsvrc12/synset_words.txt' labels = np.loadtxt(imagenet_labels_filename, str, delimiter='\t') top_k = predictions.flatten().argsort()[-1:-6:-1] for i in np.arange(top_k.size): print top_k[i], labels[top_k[i]] |
就样就可以了。运行不会报错,而且结果会显示在命令行下面。
参考链接
如何正确隐藏WordPress的版本号?
默认情况下,当你使用WordPress来搭建网站的时候,WordPress会在你的网站上留下个标记:这就是WordPress的版本号。在某些时候,这个标记也会成为网站的安全漏洞。
打开你的WordPress网站,在浏览中的空白地方点击右键,选择查看源代码,通常你会找到有这样一行代码:
|
1 |
<meta name="generator" content="WordPress 4.4.1" /> |
这是WordPress自动生成的代码,向外界宣告你所使用的WordPress版本。如果你的网站一直使用的是最新版WordPress,那你基本无需担心因为泄露版本号而导致的安全问题。但是,由于某些特殊的原因,如果你使用的是旧版本的软件,那么暴露WordPress版本号可能会成为你网站的安全漏洞。
因此,在这种情况下,你应该隐藏网站所使用的WordPress版本号。
在你的网站中,有四个地方容易暴露WordPress的版本号:
- 网站源码页头部分的
meta标签里: - 脚本和样式表文件中:
- 网站
RSS feeds中: - 网站根目录下的
readme.html文件中。
网络中各种隐藏WordPress版本号的技巧很多,功能最为完整且简洁的代码,应当是属于下面这段:
|
1 2 3 4 5 6 7 8 9 10 11 12 13 14 15 16 17 18 19 20 21 22 23 |
<?php /* 在 js 文件和 css 文件中隐藏 WordPress 版本号 * @return {string} $src * @filter script_loader_src * @filter style_loader_src */ function wpchina_remove_wp_version_strings( $src ) { global $wp_version; parse_str(parse_url($src, PHP_URL_QUERY), $query); if ( !empty($query['ver']) && $query['ver'] === $wp_version ) { $src = remove_query_arg('ver', $src); } return $src; } add_filter( 'script_loader_src', 'wpchina_remove_wp_version_strings' ); add_filter( 'style_loader_src', 'wpchina_remove_wp_version_strings' ); /* 在 generator meta 标签中隐藏 WordPress版本号 */ function wpchina_remove_version() { return ''; } add_filter('the_generator', 'wpchina_remove_version'); ?> |
这段代码可以移除前面3个地方中所包含的WP版本号。记得要把这段代码放在你所用主题(或子主题)的funcitons.php模板文件中。
修改完成后,如果是使用PHP-FPM来进行处理的服务器,需要重启PHP-FPM服务否则代码可能不能及时生效:
|
1 |
$ sudo service php5-fpm restart |
对于上面第4点提到的,位于WordPress根目录下的readme.html文件,你直接删除该文件就可以了。这份文件是关于WordPress的简单介绍和安装说明,安装好账户就没有什么用途了。
如果使用的是Apache服务器,也可以简单的在根目录下面建立.htaccess文件,里面增加如下内容:
|
1 2 3 4 5 |
# 禁止 readme.html 的访问,这个文件会暴露版本号信息 <Files readme.html> order deny,allow deny from all </Files> |
当然,以上这些做法,隐藏了WordPress的版本号,并不能真正解决网站中所存在的安全漏洞。确保网站安全的第一要素,还是要及时更新WordPress核心软件,所使用的主题、插件;使用健壮的用户名和密码;不要使用来历不明的盗版主题和插件等。
引用链接
WordPress首页显示摘要(手工设置)
用WordPress比较长的时间了,一直是在首页显示文章全文的,但是最近由于摘抄的某些文章中的图片非常多,导致每次加载首页会下载非常多的图片资源,整个页面加载速度都被拖慢了,于是想只在首页显示摘要,而不是全文显示。
网上搜索了一下,发现WordPress早就有这个功能了,如下图:
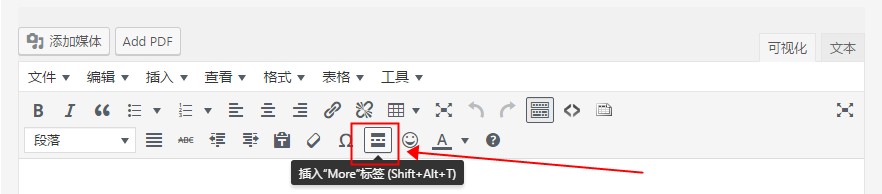
如果想手工编辑Html的话,只要简单的加入
|
1 |
<!--more--> |
标签就可以达到相同的效果了。
Mac自带的录屏工具
这个一般是指QuickTimePlayer,用这种方法对Mac屏幕录像,很多人会反应说“没有声音”,到底是怎么回事呢?让我们使用一遍就知道了。
- 右击Mac下排的QuickTimePlayer,选择“新建屏幕录制”
- 在弹出来的小窗口中,点击中间的红点,选择是否录制麦克风的声音和显示鼠标点
- 再点击小红点就可以开始录制了
- 可以按一下录制全屏,也可以拖动录制屏幕的一部分
- 点击选择录制区域中间的“开始录制”
- 屏幕中高亮部分就是正在录制的区域,点击电脑最上面的菜单上的“停止键”结束录制
- 在自动跳出来的视频中,就可以看到刚刚录制的内容
- 单击左上角的叉号,就可以选择是否储存刚刚录制的视频,以及编辑视频的名称和储存的位置
Maven 打包时丢失".properties"文件
今天在打包项目war文件的时候,突然发现居然每个action包里面的properties文件都没打进来,在网上看了半天终于找到解决方法。
问题:maven执行package命令打包时,src/main/java路径下的properties文件全部丢失。
macOS Sierra (10.12.3)编译Faiss
最近Facebook AI实验室开源了相似性搜索库Faiss。
Faiss是用于有效的相似性搜索(similarity search)和稠密矢量聚类(clustering of dense vectors)的库。它包含了可在任何大小向量集合里进行搜索的算法,向量集合的大小甚至可达到RAM容纳不下的地步。另外,它还包含了用于评估和参数调优的支持代码。Faiss用C++编写,有Python/numpy的完整包装。其中最有用的一些算法则在GPU上实现。
机器上没有安装HomeBrew的,请参考让Mac也能拥有apt-get类似的功能——Brew。
下面,我们介绍一下如何在macOS Sierra (10.12.3)上编译Faiss。
1.下载Faiss源代码
|
1 |
$ git clone https://github.com/facebookresearch/faiss.git |
2.安装编译需要的工具
|
1 |
$ brew install llvm |
3.修改调整源代码,准备编译
|
1 2 |
$ cd faiss $ cp example_makefiles/makefile.inc.Mac.brew makefile.inc |
4.编译
|
1 |
$ make all |
5.执行测试用例
|
1 2 3 4 |
#需要手工指定动态库的搜索路径,否则会提示“dyld: Library not loaded: @rpath/libomp.dylib”,导致进程无法启动 $ export DYLD_LIBRARY_PATH=$DYLD_LIBRARY_PATH:/usr/local/opt/llvm/lib/ $ ./tests/demo_ivfpq_indexing |
其余的示例,参考源代码中的INSTALL文件中的内容即可。
在Ubuntu 14.04 系统Tomcat 7 部署Apache Archiva 2.2.1一段时间后提示"apache archiva Login for user admin failed, message: Account admin is locked"的解决方法
参照 在Ubuntu 14.04 系统中的Apache Tomcat上部署Apache Archiva 2.2.1 一段时间后提示:
|
1 |
apache archiva Login for user admin failed, message: Account admin is locked |
解决方法为:
1.停止Tomcat 7服务
|
1 |
$ service tomcat7 stop |
2.移除derby数据库
|
1 |
$ rm -rf /data/Archiva/derby |
3.启动Tomcat 7服务
|
1 |
$ service tomcat7 start |
如此操作完成后,就可以在界面上出现重新设置admin用户密码的界面了。
默认情况下,每次重新设密码之后都是会在90之后会过期,正常情况下,我们只能通过修改这个默认时间为很长时间来规避这种情况。
|
1 |
$ vim /data/Archiva/conf/archiva.xml |
然后找到如下内容:
|
1 2 3 4 |
<expiration> <enabled>false</enabled> <days>90</days> </expiration> |
然后修改成:
|
1 2 3 4 |
<expiration> <enabled>false</enabled> <days>999999</days> </expiration> |
接下来,需要重启Tomcat 7服务:
|
1 |
$ service tomcat7 restart |
注意,在新版本中,貌似这样设置是无效的,重启后观察配置文件,会发现,又被改回了90天。
如何卸载Ubuntu 14.04老旧无用的Linux内核文件
相信有很多朋友会问,我已经升级 Ubuntu 内核很多次了,但要如何卸载老旧无用的 Linux 内核文件来节省磁盘空间呢?本文我们就来介绍移除老旧 Ubuntu 内核文件的方法。
在 Ubuntu 环境中,我们有很多种方式可以升级内核。 Ubuntu 桌面版本可以在每天自动更新时升级内核,Ubuntu Server 可以使用 unattended-upgrade 自动更新的方式来升级内核,当然还可以使用 apt-get 或 aptitude 来同时兼容 Ubuntu 桌面或服务器版本。
随着使用时间的推移,被替换下来的老旧内核版本将会占用一定的磁盘空间而造成浪费。每个内核映像文件和相关的模块文件/header(头文件)会占用大约 200 – 400 M 的磁盘空间,如果频繁升级内核版本,老旧内核文件对空间的浪费将会迅速增加。