从目前的测试来看只能通过R159805这个应用来开启蓝牙,但是最新的Windows 10,系统版本 1511,OS版本10586.420的系统上面,只能开启蓝牙,安装的驱动属于Windows通用驱动,因此尽管可以看到蓝牙,却不能正常使用,比如罗技M336鼠标,是无法正常使用的。
使用git tag、git describe配置编译
git tag 可以打标签 相关指令 git tag -h查看
打标签
git tag test
在打tag时,可以增加describe
git tag -m "xxx" test
注意,describe只能在打tag时使用,已存在的tag不能新增/修改describe
然后Makefile中可以这样写
VERSION := $(shell TAG_INFO=git describe)
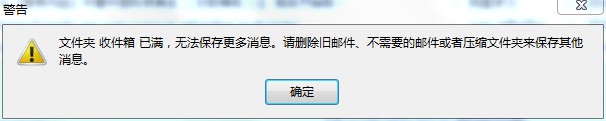
Thunderbird 45.1.1 提示“文件夹 收件箱 已满,无法保存更多消息。请删除旧邮件、不需要的邮件或者压缩文件夹来保存其他消息。”
Thunderbird使用时间长了之后,我是差不多两年多点了,打开提示“文件夹 收件箱 已满,无法保存更多消息。请删除旧邮件、不需要的邮件或者压缩文件夹来保存其他消息。”,如下图:
根据Thunderbird的中文帮助文档,可以看到如下内容:
如果数据文件夹大于 4 GB,您将会收到一个警告“文件夹已满,无法再容纳电子邮件”。在这种情况下,您必须删除某些电子邮件或移动它们至其他文件夹以减小文件夹大小。(目标文件夹大小在 1-3 GB 比较合适,具体大小取决于您的计算机的性能)
这个实际上是属于Thunderbird文件存储系统的策略问题,尽管文件系统可以处理超过4GB的文件。但是为了兼容一些古老的系统,导致即使是到了目前的版本,依旧无法处理超过4GB的文件。
目前Thunderbird一直是32位的应用,没有出64位的版本,尽管可以使用64位的API访问文件系统,但是还是默认保留了4GB的限制。
网上的删除全部的.msf的方法,只是能解决邮件发生过删除,而实际占有的空间没有释放,因而可以通过重建索引文件的方式,来缓解问题,但是如果从来没有删除过邮件,邮件实际占有的空间已经真实超过4GB的情况下,那么这些方法实际上是无效的。
正确的做法是Ctrl+A选中全部的邮件,然后右击,出现的菜单中选择"归档",即可。这样操作的实质,其实是使用子文件夹的方式突破单个文件夹4GB的限制。
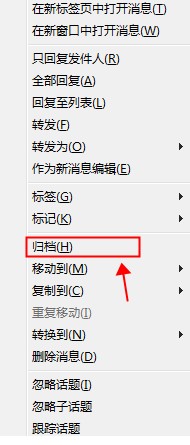
归档完成后,Thunderbird会提示是否压缩收件箱来节省空间,此时,一定要允许,否则收件箱的大小不会发生变化,如果此时没有点击许可,也可以手工在收件箱上面右击,弹出的菜单中选择压缩。
参考链接
- Thunderbird中文帮助-压缩文件夹
- Bug 789679 - Remove 4GB of folder size warning (mailboxTooLarge="The folder %S is full") after 4GB backend work is complete [4GB backend began in TB 12.0 by bug 462665]
- thunderbird提示收件箱已满的解决方法
- Compacting folders
- FAQ Thunderbird and Windows 7
- Doubt about 4GB limitation and subfolders.
Ubuntu 16.04上使用crosstool-ng建立树莓派2B的编译环境
环境准备
|
1 2 3 4 5 |
$ sudo apt-get -y update $ sudo apt-get install -y bison flex texinfo gawk automake subversion $ sudo apt-get install -y gperf help2man make libtool libncurses5-dev $ sudo apt-get install -y gcj-jdk python-dev g++ $ sudo apt-get install libtool-bin |
编译crosstool-ng
|
1 2 3 4 5 6 |
$ git clone https://github.com/crosstool-ng/crosstool-ng.git $ cd crosstool-ng $ ./bootstrap $ ./configure --prefix=/opt/crosstool-ng $ make $ sudo make install |
然后加环境变量 export PATH=$PATH:/opt/crosstool-ng/bin
配置编译选项
|
1 2 3 |
$ mkdir toolchain $ cd toolchain $ ct-ng armv7-rpi2-linux-gnueabihf |
如果想自己配置调整某些参数,则执行
|
1 |
$ ct-ng menuconfig |
最后执行
|
1 |
$ ct-ng build |
默认情况下,生成的编译工具在当前用户目录下的x-tools目录下,如果需要调整这个目录,可以参考
Mac OSX下执行crosstool-ng提示“Your file system ‘xxxx’ is *not* case-sensitive!”
编译树莓派源代码
Ubuntu 16.04 (x64)树莓派B+(Raspberry Pi B+)源代码编译
参考链接
Mac OSX EI Capitan(10.11.5)上使用crosstool-ng 1.22.0 建立树莓派2B的编译环境
背景介绍
树莓派自带的编译工具是基于Linux的,在Mac OSX上是无法正常使用的,因此比较简单的方法就是使用crosstool-ng来建立交叉编译环境。
配置编译环境
1.安装HomeBrew,方便各种工具的安装
2.使用HomeBrew安装crosstool-ng
|
1 |
$ sudo brew install crosstool-ng |
3.链接Mac OSX上的install到ginstall。Mac OSX上没有ginstall
|
1 |
$ sudo ln -s /usr/local/bin/ginstall /usr/bin/install |
如果不执行命令,则会报错
|
1 |
/Volumes/RPi-EABI/.build/tools/bin/install: line 2: exec: ginstall: not found |
4.使用HomeBrew安装expat
|
1 |
$ sudo brew install expat |
不执行此命令,我的电脑会出现crosstool-ng在配置expat的时候失败,但是两者使用的版本并不相同,另外貌似出错后,重试即可,不需要安装expat,但是稳妥起见,还是安装好了。
5.创建大小写区分的磁盘分区文件,并挂载(如果你系统创建的时候,系统分区以及区分大小写,则不必此项操作)
参考Mac OSX下执行crosstool-ng提示“Your file system ‘xxxx’ is *not* case-sensitive!”
6.在刚刚创建并挂载的大小写区分的磁盘上执行配置命令
|
1 |
$ ct-ng armv7-rpi2-linux-gnueabihf |
7.修改刚刚命令生成在当前目录下的配置文件
|
1 |
$ sudo vim .config |
找到
|
1 2 |
CT_WANTS_STATIC_LINK=y CT_CC_GCC_STATIC_LIBSTDCXX=y |
禁止使用静态链接(Mac OSX下,无法提供对于libc的静态链接,只能动态链接)
|
1 2 |
CT_WANTS_STATIC_LINK=n # set disabled CT_CC_GCC_STATIC_LIBSTDCXX=n # set disabled or comment out |
8.执行构建命令
|
1 |
$ ct-ng build |
构建中遇到的问题
如果构建出错,可以使用
|
1 |
$ ct-ng build.1 |
后面的数字代表几个并行的任务,单个任务可以更方便的查看出错的信息,多任务并发会导致日志打印的非常混乱。
在构建(ct-ng build)的时候遇到任何问题,都应该查看当前构建目录下的build.log文件,这个文件中详细记录了构建的过程信息,详细的出错信息等。
由于crosstool-ng在构建过程中需要去服务器上下载源代码,难免出现文件下载不完整的情况,这种情况下,可以从build.log文件中看到如下的内容:
|
1 2 3 4 5 6 7 8 9 |
[FILE ] tar: Retrying... [FILE ] tar: Damaged tar archive [FILE ] tar: Retrying... [FILE ] tar: Damaged tar archive [FILE ] tar: Retrying... [FILE ] tar: Damaged tar archive [FILE ] tar: Retrying... [FILE ] tar: Truncated tar archive [FILE ] tar: Error exit delayed from previous errors. |
则说明下载的源代码出现了问题。最容易出现这个问题的是gcc.以gcc-5.2.0为例子,修正的方法如下:
|
1 2 3 4 5 6 7 8 9 10 11 12 13 |
$ cd .build $ cd tarballs $ rm -rf gcc-5.2.0.tar.bz2 $ cd .. $ cd src $ rm -rf .gcc-5.2.0.extracting $ rm -rf gcc-5.2.0 |
简单解释一下代码,tarballs存储了从服务器上下载的全部源代码的压缩包,解压缩出现问题,因此必须删除,让crosstool-ng去重新下载,扩展名为.extracting文件为crosstool-ng的标记文件,用来标识这个包是不是已经被解压缩过,一旦这个文件存在crosstool-ng就认为对应的工具已经就绪了,就不会处理这个工具了,最后删除的是工具源代码的目录。
如果提示安装binutils的时候失败,如下所示:
|
1 2 3 4 5 6 7 8 9 10 11 12 13 14 15 16 17 18 19 20 21 22 23 |
[INFO ] Installing binutils for host [ERROR] /Volumes/raspberry/rpi-linux/.build/src/binutils-2.25.1/gold/gold-threads.cc:288:13: error: expected expression [ERROR] make[5]: *** [gold-threads.o] Error 1 [ERROR] make[4]: *** [all-recursive] Error 1 [ERROR] make[3]: *** [all] Error 2 [ERROR] make[2]: *** [all-gold] Error 2 [ERROR] make[1]: *** [all] Error 2 [ERROR] [ERROR] >> [ERROR] >> Build failed in step 'Installing binutils for host' [ERROR] >> called in step '(top-level)' [ERROR] >> [ERROR] >> Error happened in: CT_DoExecLog[scripts/functions@216] [ERROR] >> called from: do_binutils_backend[scripts/build/binutils/binutils.sh@240] [ERROR] >> called from: do_binutils_for_host[scripts/build/binutils/binutils.sh@105] [ERROR] >> called from: main[scripts/crosstool-NG.sh@646] [ERROR] >> [ERROR] >> For more info on this error, look at the file: 'build.log' [ERROR] >> There is a list of known issues, some with workarounds, in: [ERROR] >> '/usr/local/Cellar/crosstool-ng/1.22.0/share/doc/crosstool-ng/crosstool-ng-1.22.0/B - Known issues.txt' [ERROR] [ERROR] (elapsed: 36:53.00) [36:54] / make: *** [build] Error 1 |
查看build.log可以看到如下的内容:
|
1 2 3 4 5 6 7 8 9 |
[ERROR] /Volumes/raspberry/rpi-linux/.build/src/binutils-2.25.1/gold/gold-threads.cc:288:13: error: expected expression [ALL ] : once_(PTHREAD_ONCE_INIT) [ALL ] ^ [ALL ] /Applications/Xcode.app/Contents/Developer/Platforms/MacOSX.platform/Developer/SDKs/MacOSX10.11.sdk/usr/include/pthread.h:203:27: note: expanded from macro 'PTHREAD_ONCE_INIT' [ALL ] #define PTHREAD_ONCE_INIT {_PTHREAD_ONCE_SIG_init, {0}} [ALL ] ^ [ALL ] 1 error generated. [ERROR] make[5]: *** [gold-threads.o] Error 1 [ALL ] make[5]: *** Waiting for unfinished jobs.... |
这个BUG的原因是由于GCC的版本问题导致的,低于4.7版本的GCC无法理解这个语法,尽管Mac Osx已经使用最新的LLVM,但是遗憾的是,最新的LLVM并没有支持这个语法。解决方法如下:
|
1 |
$ vim /Volumes/raspberry/rpi-linux/.build/src/binutils-2.25.1/gold/gold-threads.cc |
找到如下代码
|
1 2 3 4 5 6 7 8 9 10 11 12 13 14 15 16 17 18 19 |
// Class Once_initialize. This exists to hold a pthread_once_t // structure for Once. class Once_initialize { public: Once_initialize() : once_(PTHREAD_ONCE_INIT) { } // Return a pointer to the pthread_once_t variable. pthread_once_t* once_control() { return &this->once_; } private: pthread_once_t once_; }; |
修改为:
|
1 2 3 4 5 6 7 8 9 10 11 12 13 14 15 16 17 18 |
// Class Once_initialize. This exists to hold a pthread_once_t // structure for Once. class Once_initialize { public: Once_initialize() {once_.__sig = _PTHREAD_ONCE_SIG_init; once_.__opaque[0] = 0;} // Return a pointer to the pthread_once_t variable. pthread_once_t* once_control() { return &this->once_; } private: pthread_once_t once_; }; |
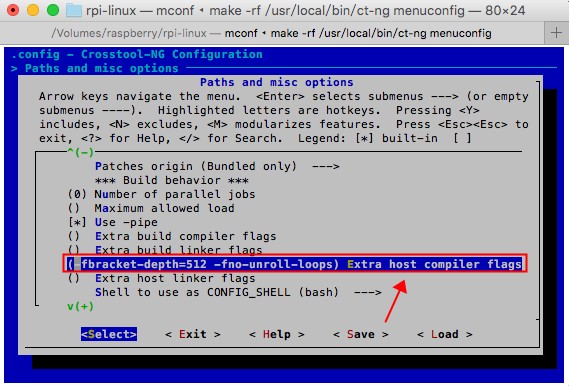
如果出现了"fatal error: bracket nesting level exceeded maximum of 256",如下所示:
|
1 2 3 4 5 6 7 8 9 |
[ERROR] /Volumes/raspberry/rpi-linux/.build/src/gcc-5.2.0/gcc/config/arm/neon.md:3463:10917: fatal error: bracket nesting level exceeded maximum of 256 [ALL ] /Volumes/raspberry/rpi-linux/.build/src/gcc-5.2.0/gcc/config/arm/neon.md:3463:10917: note: use -fbracket-depth=N to increase maximum nesting level [ALL ] 47 warnings and 1 error generated. [ERROR] make[2]: *** [insn-attrtab.o] Error 1 [ALL ] make[2]: *** Waiting for unfinished jobs.... [ALL ] 42 warnings generated. [ALL ] 18 warnings generated. [ALL ] rm gcc.pod [ERROR] make[1]: *** [all-gcc] Error 2 |
则修改方法如下:
|
1 |
$ ct-ng menuconfig |
在出现的界面中选择"Paths and misc options"项目
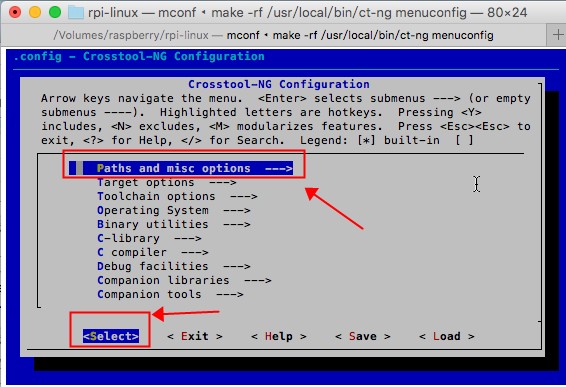
在第二级界面中不断下拉,找到"Extra host compiler flags",增加"-fbracket-depth=512",这个选项。
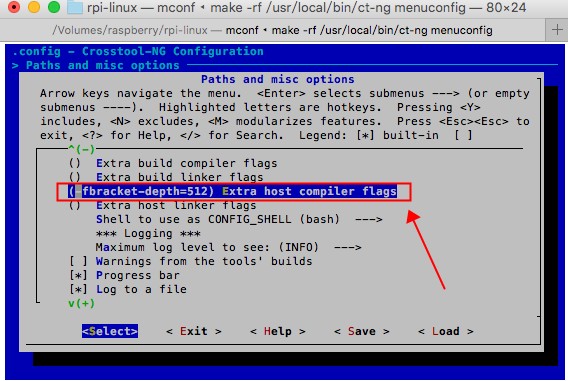
然后重新执行
|
1 |
$ ct-ng build |
如果出现错误:
|
1 2 3 4 |
[ALL ] /var/folders/h8/_f6dzm814rn1pjrgxgfvcn900000gn/T//ccU8Jut6.s: Assembler messages: [ALL ] /var/folders/h8/_f6dzm814rn1pjrgxgfvcn900000gn/T//ccU8Jut6.s:81: Error: invalid constant (af) after fixup [ALL ] /var/folders/h8/_f6dzm814rn1pjrgxgfvcn900000gn/T//ccU8Jut6.s:163: Error: invalid constant (ff) after fixup [ERROR] make[3]: *** [/Volumes/raspberry/rpi-linux/.build/armv7-rpi2-linux-gnueabihf/build/build-libc-startfiles/csu/libc-start.o] Error 1 |
这个是由于LLVM目前的版本还无法正确的理解部分GCC的汇编部分的写法,导致编译失败,而这部分的语法一般都是用在优化的时候出现错误,因此我们需要禁用这部分的优化,使用"Paths and misc options"->"Extra host compiler flags"增加 "-fno-unroll-loops"。如下图:
如果出现如下错误:
|
1 2 |
[ERROR] make[3]: *** [iconvdata/others] Error 2 [ERROR] make[2]: *** [all] Error 2 |
|
1 2 3 4 5 6 7 |
[ALL ] make[4]: *** No rule to make target `/Volumes/raspberry/rpi-linux/.build/armv7-rpi2-linux-gnueabihf/build/build-libc-final/iconvdata/MIK.so', needed by `others'. Stop. [ERROR] make[3]: *** [iconvdata/others] Error 2 [ERROR] make[2]: *** [all] Error 2 [ERROR] [ERROR] >> [ERROR] >> Build failed in step 'Installing C library' [ERROR] >> called in step '(top-level)' |
这个问题是由于编译的时候,同时打开的文件数量超过了256导致的,修复方式为在shell中增大同时打开的文件数量限制到1024:
|
1 |
$ ulimit -n 1024 |
然后在同一个shell中继续执行
|
1 |
$ ct-ng build |
如果出现如下错误,则直接忽略即可:
|
1 2 3 |
[INFO ] Installing final gcc compiler [ERROR] clang: error: unsupported option '-print-multi-os-directory' [ERROR] clang: error: no input files |
至于其他问题,貌似重试一下就可以解决了。
编译树莓派源代码
Ubuntu 16.04 (x64)树莓派B+(Raspberry Pi B+)源代码编译
参考链接
- crosstool-NG on OS X
- [DEBUG] ./.build/tools/bin/install: line 2: exec: ginstall: not found
- Building a toolchain
- fatal error: bracket nesting level exceeded maximum of 256
- [Bug binutils/19311] arm-linux-as build on Mac OS X with Xcode7 fails to
- crosstool-ng的配置参数详解
- Raspberry Pi -- Cross Compiling on Mac OSX
- Cross-compilation in OS X under Linux us crosstool-ng
- mac build woes : homebrew+iconvdata=big trouble
Mac OSX下执行crosstool-ng提示“Your file system ‘xxxx’ is *not* case-sensitive!”
在Mac下面使用HomeBrew安装了crosstool-ng来编译树莓派的代码,结果在执行的时候报告如下错误:
|
1 2 3 4 5 6 7 8 9 10 11 12 13 14 15 16 17 |
$ ct-ng build [INFO ] Performing some trivial sanity checks [ERROR] Your file system in '/Users/Documents/rpi/rpi-linux/.build' is *not* case-sensitive! [ERROR] [ERROR] >> [ERROR] >> Build failed in step '(top-level)' [ERROR] >> [ERROR] >> Error happened in: CT_Abort[scripts/functions@329] [ERROR] >> called from: CT_TestAndAbort[scripts/functions@351] [ERROR] >> called from: main[scripts/crosstool-NG.sh@93] [ERROR] >> [ERROR] >> For more info on this error, look at the file: 'build.log' [ERROR] >> There is a list of known issues, some with workarounds, in: [ERROR] >> '/usr/local/Cellar/crosstool-ng/1.22.0/share/doc/crosstool-ng/crosstool-ng-1.22.0/B - Known issues.txt' [ERROR] [ERROR] (elapsed: 24422614:07.00) [00:01] / make: *** [build] Error 1 |
比较简单的解决方法就是创建一个支持大小写区分的文件,作为一个分区挂载,然后把代码拷贝到这个分区中执行编译。
1.创建分区文件
|
1 |
$ hdiutil create -volname "Raspberry" -type SPARSE -fs 'Case-sensitive Journaled HFS+' -size 20g raspberry.dmg |
2.挂载分区
早期版本的Mac OS X
|
1 2 3 4 |
$ hdiutil attach raspberry.dmg -mountpoint /Volumes/raspberry # 切换到挂载目录 $ cd /Volumes/raspberry/ |
对于OS X EI Capitan(10.11.5)版本而言,生成的文件名变成了raspberry.dmg.sparseimage因此需要使用这个文件来挂载
|
1 2 3 4 |
$ hdiutil attach raspberry.dmg.sparseimage -mountpoint /Volumes/raspberry # 切换到挂载目录 $ cd /Volumes/raspberry/ |
挂载后会在桌面生成一个名为Raspberry的磁盘文件夹生成,直接操作这个目录即可。
3.修改crosstool-ng的编译工具下载目录
|
1 |
$ ct-ng menuconfig |
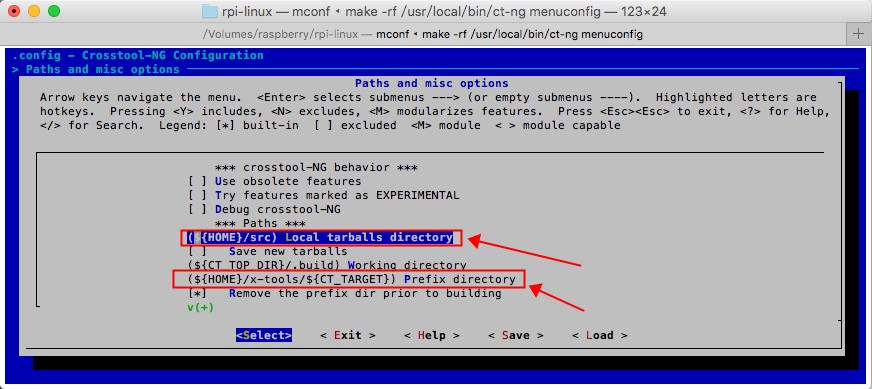
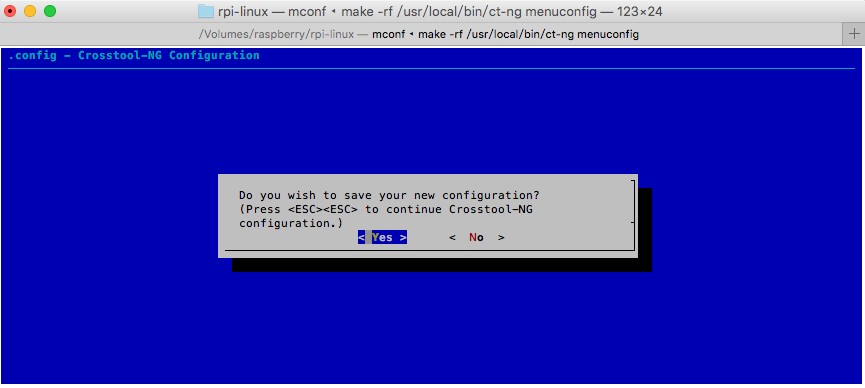
如下图的方式进行操作:
1.选择"Paths and misc options",并选中"Select"之后点击回车按键
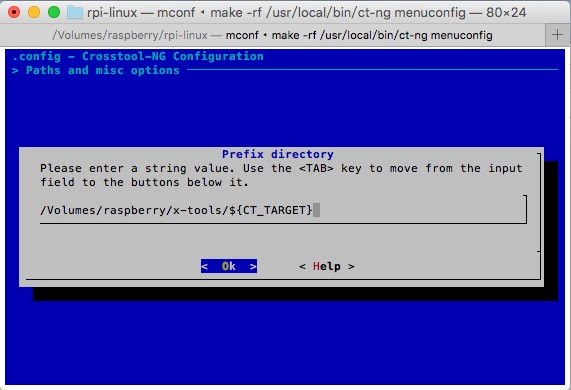
2.点击向下的方向按键,,找到"(${Home}/src) Local tarballs directory",这个项,并选中"Select"之后点击回车按键,修改为"/Volumes/raspberry/src",然后继续向下,找到"(${Home}/x-tools/${CT_TARGET}) Prefix directory",这个项,并选中"Select"之后点击回车按键,修改为"/Volumes/raspberry/x-tools/${CT_TARGET}"
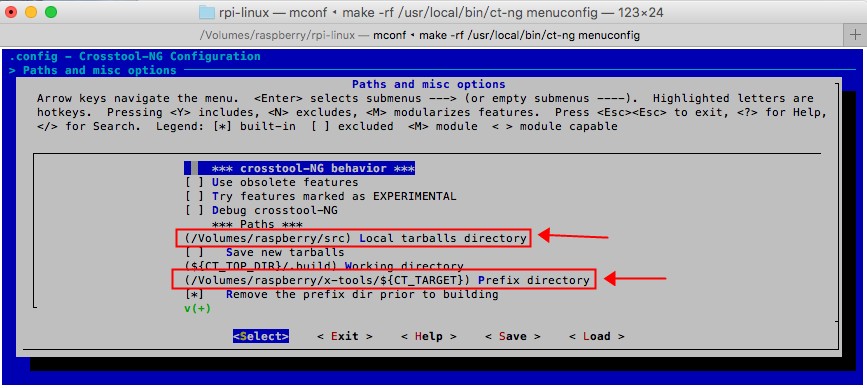
修改后的结果如下图:
完成操作后,不断快速按下Esc按键,在最后弹出的确认保存窗口中选择保存即可,如下图:
4.卸载分区
|
1 |
$ hdiutil detach /Volumes/raspberry |
Ubuntu 16.04 (x64)树莓派B+(Raspberry Pi B+)源代码编译
树莓派上的操作
1.升级到最新版内核保证与下载的内核源码版本一致
|
1 |
$ sudo rpi-update |
2.升级完整后重启
|
1 |
$ sudo reboot |
3.查看内核版本
|
1 |
$ uname -r |
4.把最新版本的内核配置保存到.config中,以备以后编译内核使用
|
1 |
$ sudo modprobe configs |
文件被存储到了/proc/config.gz中。
目前最新版本是4.4.12,因此下面的编译都是针对4.4.y这个分支进行的。
Debian/Ubuntu下编译
1.获取内核源代码
|
1 2 3 4 5 |
$ cd ~ $ mkdir rpi $ cd rpi |
2,以下步骤时间很长,可以在睡觉前执行,并且可能需要重试几次才行,建议同时开三个Shell一起执行。
|
1 2 3 4 5 6 7 |
# core.symlinks=true 软连接处理,否则会出现各种找不到文件的问题 $ git -c core.symlinks=true clone https://github.com/raspberrypi/firmware.git rpi-firmware $ git -c core.symlinks=true clone https://github.com/raspberrypi/linux.git rpi-linux $ git -c core.symlinks=true clone https://github.com/raspberrypi/tools.git rpi-tools |
3.给予整个rpi-tools目录执行权限,默认可能没有执行权限
|
1 |
$ chmod +x -R rpi-tools |
4.整个的rpi-linux的文件夹的所有者更改为当前用户,否则存在一定程度的编译问题,特别是代码从其他系统上拷贝过来的情况
|
1 |
$ sudo chown -R `whoami` rpi-linux/ |
5.设置编译器的路径
|
1 |
$ export PATH=$PATH:~/rpi/rpi-tools/arm-bcm2708/gcc-linaro-arm-linux-gnueabihf-raspbian-x64/bin |
6.配置编译类型
|
1 2 3 4 5 6 7 8 |
$ cd rpi-linux/ # 检出分支 $ git checkout rpi-4.4.y $ KERNEL=kernel $ make ARCH=arm CROSS_COMPILE=arm-linux-gnueabihf- bcmrpi_defconfig |
如果提示是否增加新的驱动支持,默认全部选择否(输入大写的字母N,小写字母无效),否则会导致无法编译通过。
7.开始正式编译内核,最后的数字改成比你的CPU核心数量+1以提交多线程编译效率。
|
1 2 3 |
$ make clean $ make ARCH=arm CROSS_COMPILE=arm-linux-gnueabihf- zImage modules dtbs -j5 |
8.编译错误修正,如果提示如下错误
|
1 2 3 4 5 6 7 8 9 10 11 |
DTC arch/arm/boot/dts/bcm2708-rpi-b.dtb In file included from arch/arm/boot/dts/bcm2708.dtsi:1:0, from arch/arm/boot/dts/bcm2708-rpi-b.dts:3: arch/arm/boot/dts/bcm2708_common.dtsi:1:39: fatal error: dt-bindings/clock/bcm2835.h: 没有那个文件或目录 #include "dt-bindings/clock/bcm2835.h" ^ compilation terminated. scripts/Makefile.lib:293: recipe for target 'arch/arm/boot/dts/bcm2708-rpi-b.dtb' failed make[1]: *** [arch/arm/boot/dts/bcm2708-rpi-b.dtb] Error 1 arch/arm/Makefile:340: recipe for target 'dtbs' failed make: *** [dtbs] Error 2 |
这个现象的原因是 git 在检出代码的时候,没有正确处理软连接,我们只需要重新处理一次即可。如下:
|
1 2 3 4 5 |
# 软连接处理,否则会出现各种找不到文件的问题 $ git config core.symlinks true $ git reset --hard |
9.查看生成的内核镜像文件
|
1 |
$ cd rpi-linux/arch/arm/boot |
生成的zImage就是我们需要的kernel.img。
10.编译modules
|
1 2 3 4 5 6 7 |
$ cd ../.. $ mkdir modules $ cd rpi-linux $ make modules_install ARCH=arm CROSS_COMPILE=arm-linux-gnueabihf- INSTALL_MOD_PATH=../modules -j5 |
安装编译好的内核
Ubuntu下面,SD卡会自动挂载,默认挂载到了/media/目录下面,如果是使用NOOBS安装的话,系统目录是固定的,执行如下命令拷贝到目标SD卡上面
|
1 2 3 4 5 6 7 8 9 10 11 12 13 14 15 |
$ mv /media/`whoami`/boot/kernel.img /media/`whoami`/boot/kernel_old.img $ cp rpi-linux/arch/arm/boot/zImage /media/`whoami`/boot/kernel.img $ mv /media/`whoami`/boot/bootcode.bin /media/`whoami`/boot/bootcode_old.bin $ mv /media/`whoami`/boot/fixup.dat /media/`whoami`/boot/fixup_old.dat $ mv /media/`whoami`/boot/fixup_cd.dat /media/`whoami`/boot/fixup_cd_old.dat $ mv /media/`whoami`/boot/start.elf /media/`whoami`/boot/start_old.elf $ cd rpi-firmware/boot $ cp bootcode.bin fixup.dat fixup_cd.dat start.elf /media/`whoami`/boot/ |
参考链接
WD MyCloud下面Git提交(Push)失败 index-pack died of signal 9
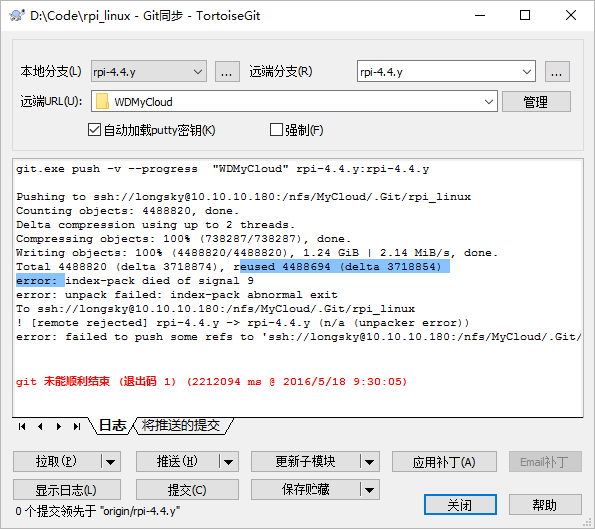
WD MyCloud下面Git提交(Push)失败
|
1 |
error: index-pack died of signal 9 |
如下图所示:
根据网上的其他人的讨论,采用过
1.安装最新的git(2.14)(无效)
2.限制git处理的文件的大小,超过大小则保持原始文件不变 (无效)
|
1 |
$ git config --add core.bigFileThreshold 4m |
3.限制线程数量(无效)
|
1 |
$ git config pack.threads 1 |
4.限制pack的内存占用(无效)
|
1 |
$ git config pack.windowMemory 10m |
5.限制pack的内存以及文件大小(无效)
|
1 2 3 |
$ git config pack.windowMemory 10m $ git config pack.packSizeLimit 20m |
6.使用上面的配置,重新在大内存电脑上重建索引提交(无效)
|
1 2 3 4 5 6 7 8 9 |
$ git config --add core.bigFileThreshold 4m $ git config pack.windowMemory 10m $ git config pack.packSizeLimit 20m $ git config pack.threads 1 $ git repack -a -d --window-memory 10m --max-pack-size 20m |
7.增大交换分区(提交过程变得巨慢,耗费了三天后提示失败,无效)
|
1 2 3 4 5 |
$ cd /nfs/WDMyCloud/ $ dd if=/dev/zero of=swapfile bs=1m count=4096 $ swapon swapfile |
最后的解决方法,其实就是在足够内存的机器上面,提交到本机,然后使用scp作为一个文件夹同步到WDMyCloud中。
参考链接
Android:如何重启app?
重启App,目前有两种办法:
1.使用 PendingIntent,设置在未来某个时刻启动你的app,然后关掉app。
|
1 2 3 4 5 6 |
Intent mStartActivity = new Intent(context, MainActivity.class); int mPendingIntentId = 123456; PendingIntent mPendingIntent = PendingIntent.getActivity(context, mPendingIntentId, mStartActivity, PendingIntent.FLAG_CANCEL_CURRENT); AlarmManager mgr = (AlarmManager)MeConfigs.context.getSystemService(Context.ALARM_SERVICE); mgr.set(AlarmManager.RTC, System.currentTimeMillis() + 100, mPendingIntent); System.exit(0); |
2.使用NEW_TASK的flag打开ActivityB,然后关掉当前进程,ActivityB马上再打开app。
重启代码
|
1 2 3 4 |
Intent i = new Intent(getApplicationContext(), DummyActivity.class); i.setFlags(Intent.FLAG_ACTIVITY_CLEAR_TASK | Intent.FLAG_ACTIVITY_NEW_TASK); startActivity(i); Process.killProcess(Process.myPid()); |
ActivityB代码
|
1 2 3 4 5 6 7 8 9 |
protected void onCreate(Bundle savedInstanceState) { super.onCreate(savedInstanceState); Intent i = new Intent(); i.setData(Uri.parse("xxx")); i.setFlags(Intent.FLAG_ACTIVITY_CLEAR_TASK | Intent.FLAG_ACTIVITY_NEW_TASK); startActivity(i); finish(); } |
JSON相关:JSON-bundle
JSON转成bundle
|
1 2 3 4 5 6 7 8 |
Intent intent = new Intent(); JSONObject extrasJson = new JSONObject(extras); Iterator<String> keys=extrasJson.keys(); while (keys.hasNext()) { String key = keys.next(); // 可以根据opt出来的不同类型put intent.put(key, extrasJson.optString(key)); } |
这里有一个需要注意的地方,SDK19以后,用wrap可以更好的处理get出来是map、array等问题。
bundle转JSON 也就是遍历bundle
|
1 2 3 4 5 6 7 8 9 10 |
JSONObject json = new JSONObject(); Set<String> keys = bundle.keySet(); for (String key : keys) { try { // json.put(key, bundle.get(key)); see edit below json.put(key, JSONObject.wrap(bundle.get(key))); } catch(JSONException e) { //Handle exception here } } |