首先,回顾一下基础知识,基础知识是理解系统机制的前提和关键:
1、 进程的地址空间
在32位操作系统中,进程的地址空间为0到4GB,
示意图如下:
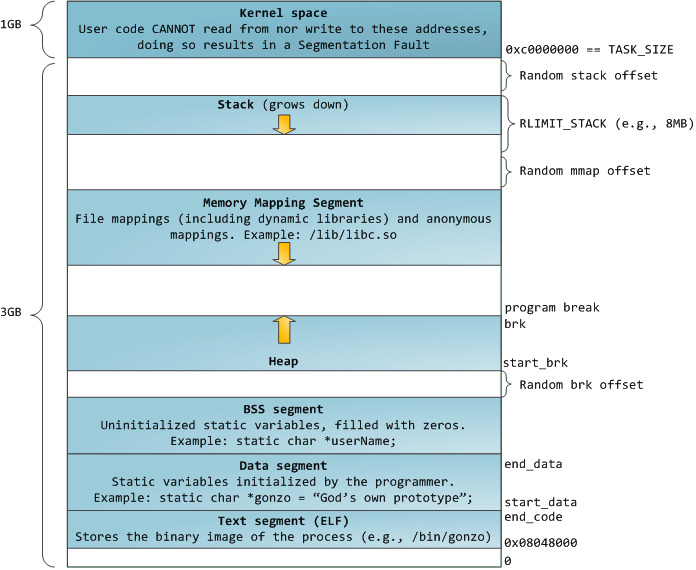
这里主要说明一下Stack和Heap:
Stack空间(进栈和出栈)由操作系统控制,其中主要存储函数地址、函数参数、局部变量等等,所以Stack空间不需要很大,一般为几MB大小。
Heap空间的使用由程序员控制,程序员可以使用malloc、new、free、delete等函数调用来操作这片地址空间。Heap为程序完成各种复杂任务提供内存空间,所以空间比较大,一般为几百MB到几GB。正是因为Heap空间由程序员管理,所以容易出现使用不当导致严重问题。
2、进程内存空间和RAM之间的关系
进程的内存空间只是虚拟内存(或者叫作逻辑内存),而程序的运行需要的是实实在在的内存,即物理内存(RAM)。在必要时,操作系统会将程序运行中申请的内存(虚拟内存)映射到RAM,让进程能够使用物理内存。
RAM作为进程运行不可或缺的资源,对系统性能和稳定性有着决定性影响。另外,RAM的一部分被操作系统留作他用,比如显存等等,内存映射和显存等都是由操作系统控制,我们也不必过多地关注它,进程所操作的空间都是虚拟地址空间,无法直接操作RAM。
示意图如下:
3、 Android中的进程
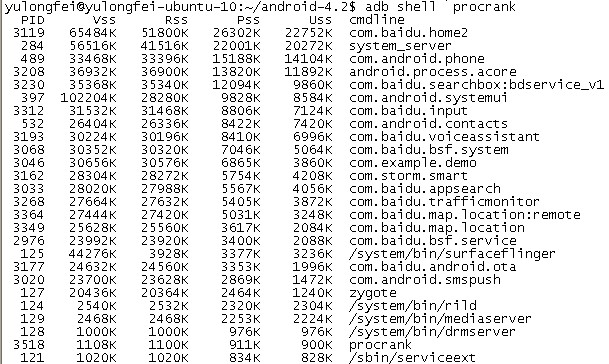
(1) native进程:采用C/C++实现,不包含dalvik实例的进程,/system/bin/目录下面的程序文件运行后都是以native进程形式存在的。如下图所示,/system/bin/surfaceflinger、/system/bin/rild、procrank等就是native进程。
(2) java进程:Android中运行于dalvik虚拟机之上的进程。dalvik虚拟机的宿主进程由fork()系统调用创建,所以每一个java进程都是存在于一个native进程中,因此,java进程的内存分配比native进程复杂,因为进程中存在一个虚拟机实例。如下图,Android系统中的应用程序基本都是java进程,如桌面、电话、联系人、状态栏等等。
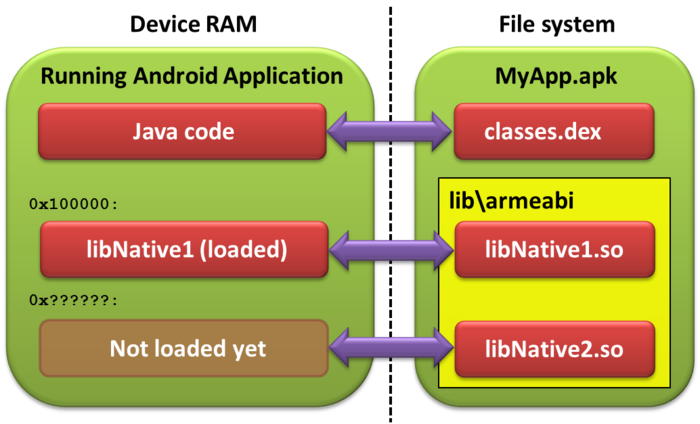
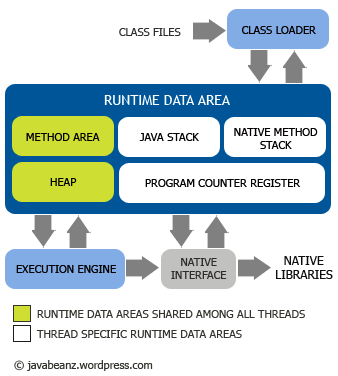
4、 Android中进程的堆内存
进程空间中的heap空间是我们需要重点关注的。heap空间完全由程序员控制,我们使用的malloc、C++ new和java new所申请的空间都是heap空间, C/C++申请的内存空间在native heap中,而java申请的内存空间则在dalvik heap中。
5、 Android的 java程序为什么容易出现OOM
这个是因为Android系统对dalvik的vm heapsize作了硬性限制,当java进程申请的java空间超过阈值时,就会抛出OOM异常(这个阈值可以是48M、24M、16M等,视机型而定),可以通过adb shell getprop | grep dalvik.vm.heapgrowthlimit查看此值。
也就是说,程序发生OMM并不表示RAM不足,而是因为程序申请的java heap对象超过了dalvik vm heapgrowthlimit。也就是说,在RAM充足的情况下,也可能发生OOM。
这样的设计似乎有些不合理,但是Google为什么这样做呢?这样设计的目的是为了让Android系统能同时让比较多的进程常驻内存,这样程序启动时就不用每次都重新加载到内存,能够给用户更快的响应。迫使每个应用程序使用较小的内存,移动设备非常有限的RAM就能使比较多的app常驻其中。但是有一些大型应用程序是无法忍受vm heapgrowthlimit的限制的,后面会介绍如何让自己的程序跳出vm heapgrowthlimit的限制。
6、 Android如何应对RAM不足
在第5点中提到:java程序发生OMM并不是表示RAM不足,如果RAM真的不足,会发生什么呢?这时Android的memory killer会起作用,当RAM所剩不多时,memory killer会杀死一些优先级比较低的进程来释放物理内存,让高优先级程序得到更多的内存。我们在分析log时,看到的进程被杀的log,如图5,往往就是属于这种情况。

7、 如何查看RAM使用情况
可以使用
|
1 |
adb shell cat /proc/meminfo |
查看RAM使用情况:
|
1 2 3 4 5 6 7 8 9 10 11 12 13 14 15 16 17 18 19 20 21 22 23 24 |
MemTotal: 396708 kB MemFree: 4088 kB Buffers: 5212 kB Cached: 211164 kB SwapCached: 0 kB Active: 165984 kB Inactive: 193084 kB Active(anon): 145444 kB Inactive(anon): 248 kB Active(file): 20540 kB Inactive(file): 192836 kB Unevictable: 2716 kB Mlocked: 0 kB HighTotal: 0 kB HighFree: 0 kB LowTotal: 396708 kB LowFree: 4088 kB SwapTotal: 0 kB SwapFree: 0 kB Dirty: 0 kB Writeback: 0 kB AnonPages: 145424 kB …… …… |
这里对其中的一些字段进行解释:
MemTotal:可以使用的RAM总和(小于实际RAM,操作系统预留了一部分)
MemFree:未使用的RAM
Cached:缓存(这个也是app可以申请到的内存)
HightTotal:RAM中地址高于860M的物理内存总和,只能被用户空间的程序使用。
HightFree:RAM中地址高于860M的未使用内存
LowTotal:RAM中内核和用户空间程序都可以使用的内存总和(对于512M的RAM: lowTotal= MemTotal)
LowFree: RAM中内核和用户空间程序未使用的内存(对于512M的RAM: lowFree = MemFree)
8、 如何查看进程的内存信息
(1)、使用
|
1 |
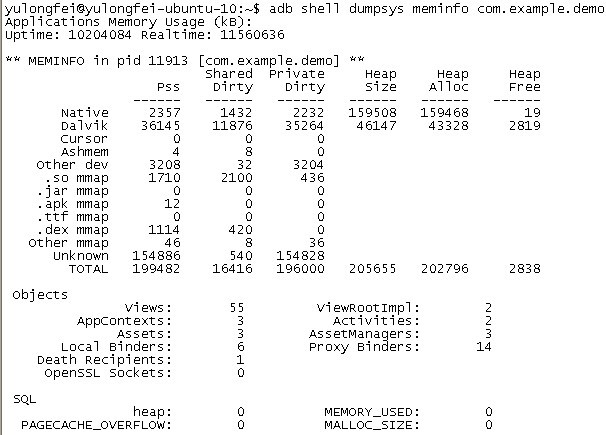
adb shell dumpsys meminfo packagename/pid |
从下图可以看出,com.example.demo作为java进程有2个heap,native heap和dalvik heap,native heap size为159508KB,dalvik heap size为46147KB
(2)使用
|
1 |
adb shell procrank |
查看进程内存信息
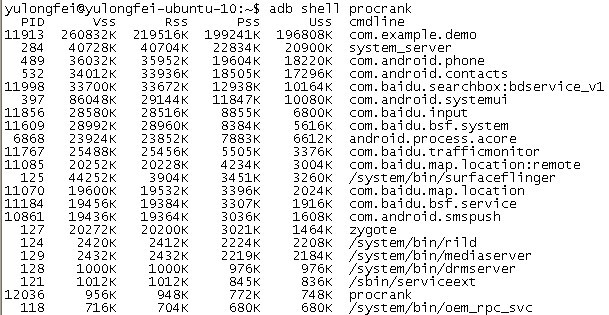
解释一些字段的意思:
VSS- Virtual Set Size 虚拟耗用内存(包含共享库占用的内存)
RSS- Resident Set Size 实际使用物理内存(包含共享库占用的内存)
PSS- Proportional Set Size 实际使用的物理内存(比例分配共享库占用的内存)
USS- Unique Set Size 进程独自占用的物理内存(不包含共享库占用的内存)
一般来说内存占用大小有如下规律:VSS >= RSS >= PSS >= USS
注意:procrank可以查看native进程和java进程,而dumpsys meminfo只能查看java进程。
9、 应用程序如何绕过dalvikvm heapsize的限制
对于一些大型的应用程序(比如游戏),内存使用会比较多,很容易超超出vm heapsize的限制,这时怎么保证程序不会因为OOM而崩溃呢?
(1)创建子进程
创建一个新的进程,那么我们就可以把一些对象分配到新进程的heap上了,从而达到一个应用程序使用更多的内存的目的,当然,创建子进程会增加系统开销,而且并不是所有应用程序都适合这样做,视需求而定。
创建子进程的方法:使用android:process标签
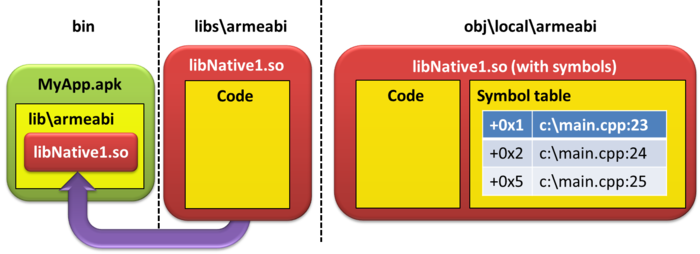
(2)使用jni在native heap上申请空间(推荐使用)
nativeheap的增长并不受dalvik vm heapsize的限制,从图6可以看出这一点,它的native heap size已经远远超过了dalvik heap size的限制。
只要RAM有剩余空间,程序员可以一直在native heap上申请空间,当然如果 RAM快耗尽,memory killer会杀进程释放RAM。大家使用一些软件时,有时候会闪退,就可能是软件在native层申请了比较多的内存导致的。比如,我就碰到过UC web在浏览内容比较多的网页时闪退,原因就是其native heap增长到比较大的值,占用了大量的RAM,被memory killer杀掉了。
(3)使用显存(操作系统预留RAM的一部分作为显存)
使用OpenGL textures等API,texture memory不受dalvik vm heapsize限制,这个我没有实践过。再比如Android中的GraphicBufferAllocator申请的内存就是显存。
10、Bitmap分配在native heap还是dalvik heap上?
答案是 Android 2.X 版本上,大部分都是在 native heap上面,dalvik heap上保存引用,因此才会在Android 文档上明确推荐手动调用 recycle 函数回收内存。从3.X版本开始,都在dalvik heap上开辟内存,因此也就没有上述的推荐调用了。