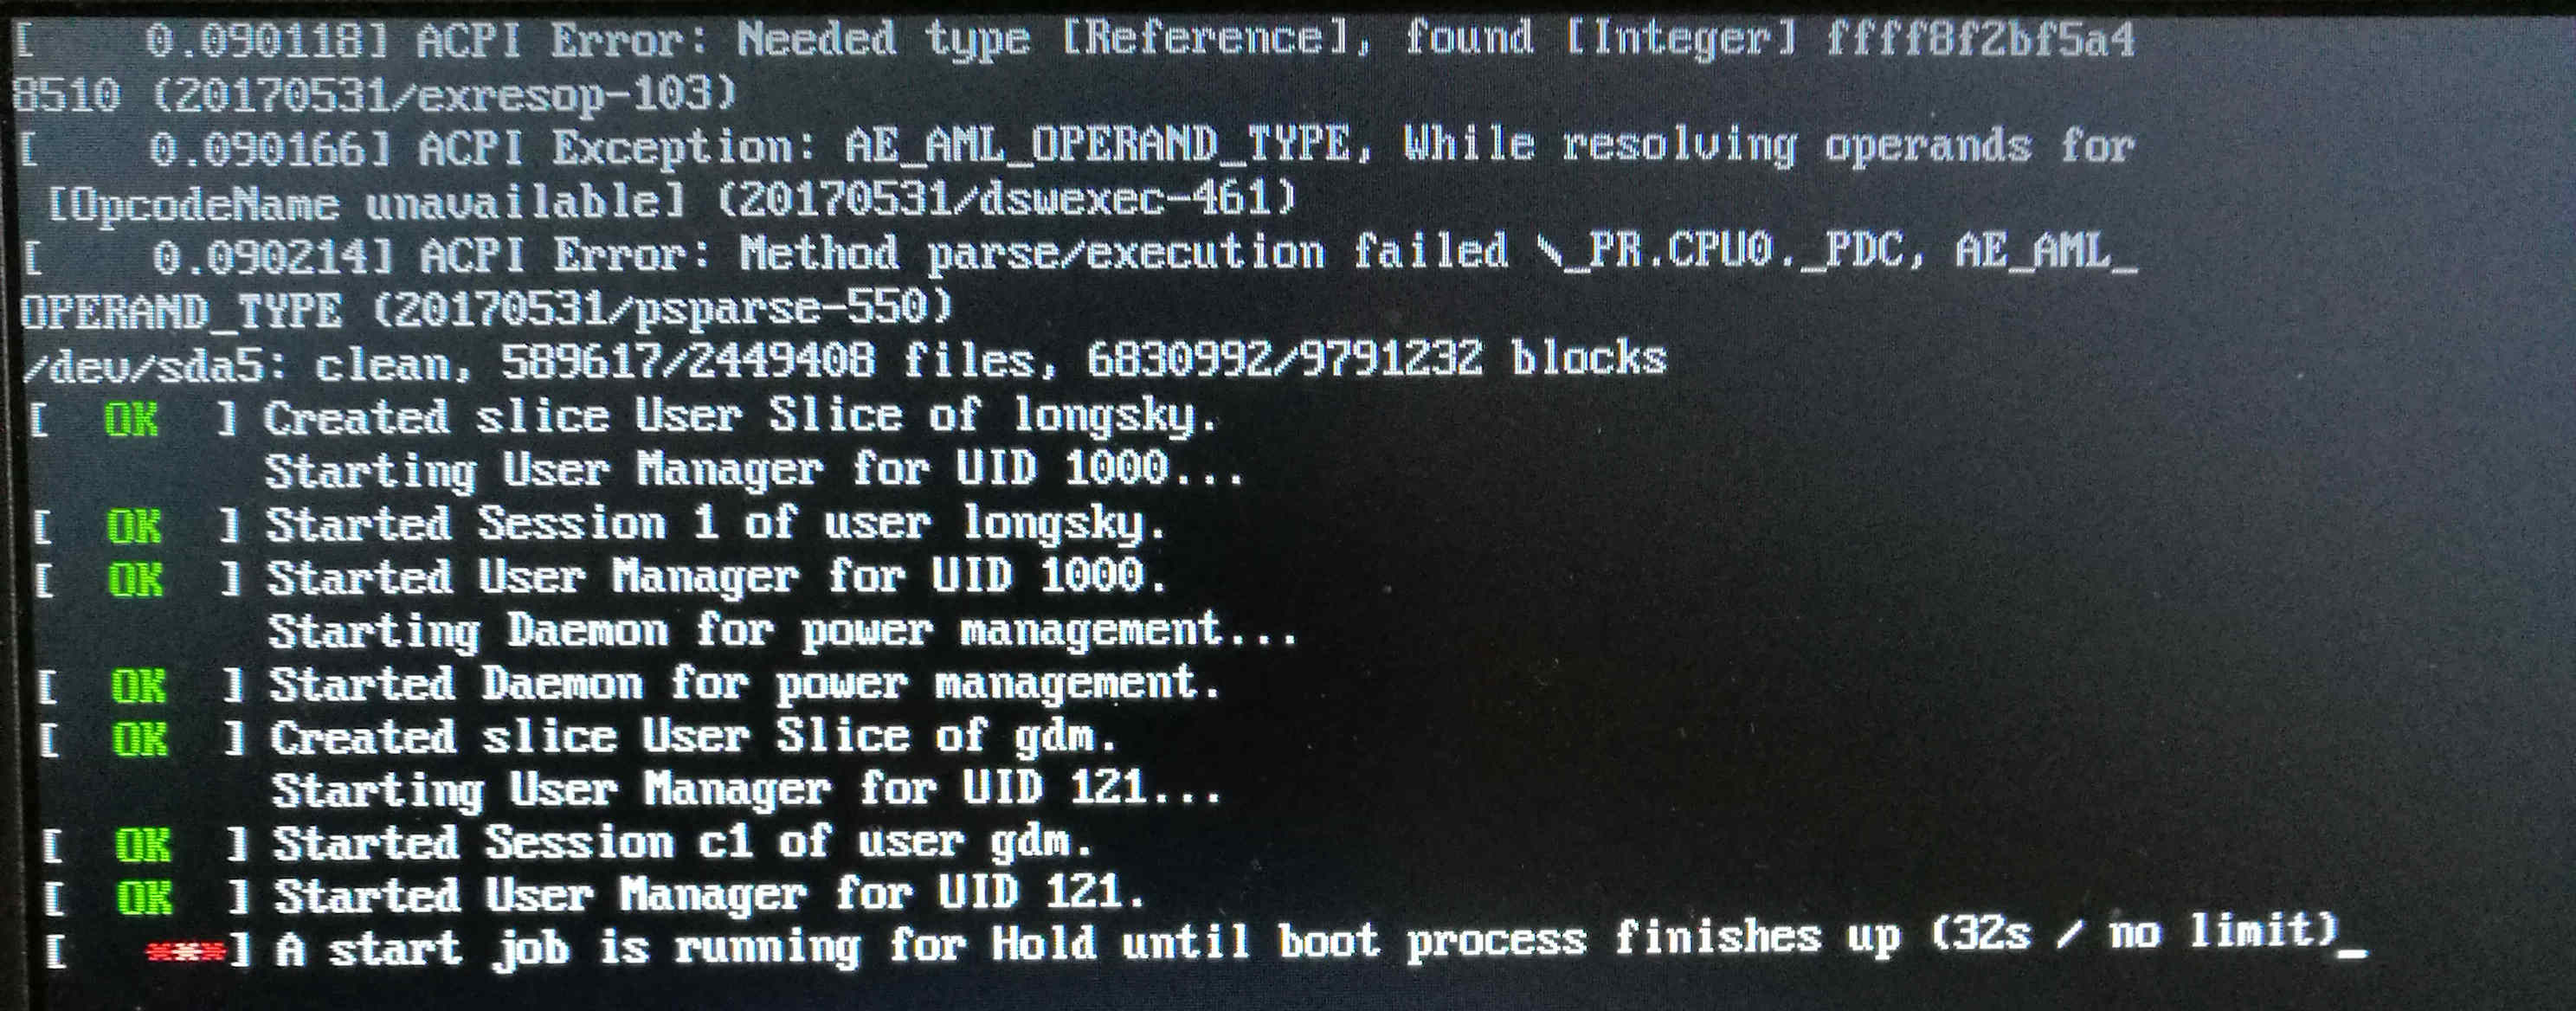
Chrome Extension:Debugging

This tutorial introduces you to using Google Chrome's built-in Developer Tools to interactively debug an extension.

View extension information

To follow this tutorial, you need the Hello World extension that was featured inGetting Started. In this section, you'll load the extension and take a look at its information in the Extensions page.

  1. Load the Hello World extension if it isn't already running. If the extension is running, you'll see the Hello World icon  to the right of your browser's address bar.If the Hello World extension isn't already running, find the extension files and load them. If you don't have a handy copy of the files, extract them from this ZIP file. See Getting Started if you need instructions for loading the extension.
  2. Go to the Extensions page (chrome://extensions), and make sure the page is in Developer mode.
  3. Look at the Hello World extension's information on that page. You can see details such as the extension's name, description, and ID.

Inspect the popup

As long as your browser is in Developer mode, it's easy to inspect popups.

  1. Go to the Extensions page (chrome://extensions), and make sure Developer mode is still enabled. The Extensions page doesn't need to be open for the following to work. The browser remembers the setting, even when the page isn't shown.
  2. Right-click the Hello World icon  and choose the Inspect popup menu item. The popup appears, and a Developer Tools window like the following should display the code for popup.html.The popup remains open as long as the Developer Tools window does.
  3. If the Scripts button isn't already selected, click it.
  4. Click the console button (second from left, at the bottom of the Developer Tools window) so that you can see both the code and the console.

Use the debugger

In this section, you'll follow the execution of the popup page as it adds images to itself.

    1. Set a breakpoint inside the image-adding loop by searching for the string img.src and clicking the number of the line where it occurs (for example, 37):
    2. Make sure you can see the popup.html tab. It should show 20 "hello world" images.
    3. At the console prompt, reload the popup page by entering location.reload(true):

      The popup page goes blank as it begins to reload, and its execution stops at line 37.
    4. In the upper right part of the tools window, you should see the local scope variables. This section shows the current values of all variables in the current scope. For example, in the following screenshot the value of i is 0, and photos is a node list that contains at least a few elements. (In fact, it contains 20 elements at indexes 0 through 19, each one representing a photo.)
    5. Click the play/pause button (near the top right of the Developer Tools window) to go through the image-processing loop a single time. Each time you click that button, the value of i increments and another icon appears in the popup page. For example, when i is 10, the popup page looks something like this:

  1. Use the buttons next to the play/pause button to step over, into, and out of function calls. To let the page finish loading, click line 37 to disable the breakpoint, and then press play/pause to continue execution.

Summary

This tutorial demonstrated some techniques you can use to debug your extensions:

  • Find your extension's ID and links to its pages in the Extensions page (chrome://extensions).
  • View hard-to-reach pages (and any other file in your extension) using chrome-extension://extensionId/filename.
  • Use Developer Tools to inspect and step through a page's JavaScript code.
  • Reload the currently inspected page from the console using location.reload(true).

Now what?

Now that you've been introduced to debugging, here are suggestions for what to do next:

  • Watch the extensions video Developing and Debugging.
  • Try installing and inspecting other extensions, such as the samples.
  • Try using widely available debugging APIs such as console.log() and console.error() in your extension's JavaScript code. Example: console.log("Hello, world!")
  • Follow the Developer Tools tutorial, explore the Developer Tools site, and watch some video tutorials.

For more ideas, see the Now what? section of Getting Started.

CMake如何编译CUDA(.cu)源文件

现在的项目,如果需要用到计算加速,NvidiaCUDA往往是首选。那么如何在CMake中编译写好的CUDA源代码,可以参考如下。

首先使用FIND_PACKAGE找到已经安装的CUDA,此时需要配置的环境变量等,应该已经自动配置完成了

接下来,使用CUDA_ADD_LIBRARY取代原来的ADD_LIBRARY,如下:

如果是可执行程序,请使用CUDA_ADD_EXECUTABLE取代ADD_EXECUTABLE

参考链接


CMake: how to add cuda to existing project

Getting Started: Building a Chrome Extension

Extensions allow you to add functionality to Chrome without diving deeply into native code. You can create new extensions for Chrome with those core technologies that you're already familiar with from web development: HTML, CSS, and JavaScript. If you've ever built a web page, you should feel right at home with extensions pretty quickly; we'll put that to the test right now by walking through the construction of a simple extension that will allow the user to change the background color of the current webpage.

继续阅读Getting Started: Building a Chrome Extension

Chrome扩展:Manifest文件格式

任何扩展程序都有一个 JSON 格式的 manifest 文件,以 manifest.json 命名,记录了重要信息。

下列代码展示了扩展程序支持的 manifest 字段,点击字段链接可以查看详情。

{
"manifest_version": 2,
"name": "My Extension",
"version": "versionString",// Recommended
"default_locale": "en",
"description": "A plain text description",
"icons": {...},// Pick one (or none)
"browser_action": {...},
"page_action": {...},// Optional
"author": ...,
"automation": ...,
"background": {
// Recommended
"persistent": false

},
"background_page": ...,
"chrome_settings_overrides": {...},
"chrome_ui_overrides": {
"bookmarks_ui": {
"remove_bookmark_shortcut": true,
"remove_button": true
}

},
"chrome_url_overrides": {...},
"commands": {...},
"content_capabilities": ...,
"content_scripts": [{...}],
"content_security_policy": "policyString",
"converted_from_user_script": ...,
"current_locale": ...,
"devtools_page": "devtools.html",
"event_rules": [{...}],
"externally_connectable": {
"matches": ["*://*.example.com/*"]
},
"file_browser_handlers": [...],
"file_system_provider_capabilities": {
"configurable": true,
"multiple_mounts": true,
"source": "network"

},
"homepage_url": "http://path/to/homepage",
"import": [{"id": "aaaaaaaaaaaaaaaaaaaaaaaaaaaaaaaa"}],
"incognito": "spanning, split, or not_allowed",
"input_components": ...,
"key": "publicKey",
"minimum_chrome_version": "versionString",
"nacl_modules": [...],
"oauth2": ...,
"offline_enabled": true,
"omnibox": {
"keyword": "aString"
},
"optional_permissions": ["tabs"],
"options_page": "options.html",
"options_ui": {
"chrome_style": true,
"page": "options.html"

},
"permissions": ["tabs"],
"platforms": ...,
"plugins": [...],
"requirements": {...},
"sandbox": [...],
"short_name": "Short Name",
"signature": ...,
"spellcheck": ...,
"storage": {
"managed_schema": "schema.json"
},
"system_indicator": ...,
"tts_engine": {...},
"update_url": "http://path/to/updateInfo.xml",
"version_name": "aString",
"web_accessible_resources": [...]

}

Chrome扩展:构建一个 Chrome 扩展程序

扩展程序可以让我们不需要深入了解Chrome的原生代码就可以扩展Chrome浏览器的功能。 你可以用已经掌握的web开发核心技术HTMLCSS,和JavaScript来创建Chrome扩展程序。 如果你以前开发过网页,你可以很快地上手开发扩展程序; 接下来我们就马上开始,一步步地开发一个简单的扩展程序,这个扩展程序的作用是找出当前页面中所使用的谷歌服务器图片。

继续阅读Chrome扩展:构建一个 Chrome 扩展程序

ubuntu 16.04.3上apache 2.4.18通过HTTP_REFERER阻止图片盗链

最近偶尔碰到网站的流量被消耗尽的情况,已经影响到自己的使用了。怀疑网站图片,数据等被盗链,导致流量被消耗。

ubuntu 16.04.3apache 2.4.18防止网站图片被盗链的方法如下:

首先是在根目录下创建一个.htaccess,如果已经有了,直接把下面的代码添加到.htaccess尾部即可。

简单的解释下每条语句:

允许空“HTTP_REFERER”的访问,即允许用户在浏览器地址栏中直接输入图片地址时图片文件的显示。一般而言,这是可选的,不过,建议这么设置,如果强迫必须具有“HTTP_REFERER”才能访问,可能会带来某些问题,比如说在用户通过代理服务器访问时。

设置允许访问的HTTP来源,包括我们的站点自身、GoogleBaidu等。这个可以添加多条,目前我们配置只有自身还有谷歌百度等常用的搜索引擎的访问权限。

定义被盗链时替代的链接,可以是图片,也可以是404错误页,目前我们定义的是首页,所以就是mobibrw.com,如果是要定义在404页面,可以把404页面的路径加上。当然替换的页面文件体积越小越好。你也可以不设置替换图片,而是使用下面的语句即可(服务器返回403禁止访问):

参考链接


网站如何防止图片被盗链!怎么样让网站的图片不被其他网站调用

ubuntu 16.04.3上apache2服务器报告错误“script not found or unable to stat: /usr/lib/cgi-bin/php*”

最近在查看服务器上的apache2的错误日志的时候,发现如下错误信息:

刚刚开始感觉莫名其妙,因为PHP的解析已经通过PHP-FPM模式进行处理,服务器上的配置已经不需要cgi进行处理了。

网上搜索了一下,发现这个是由于ubuntuapache2的默认配置模版导致的,尤其是从ubuntu 12.04一路升级上来的系统,在配置模版中有指出/usr/lib/cgi-bin/这个路径,可是这个路径已经不再使用了。

修改方式如下:

向下查找,会发现如下内容:

如果确实网站已经不再使用任何cgi相关的东西了,可以直接注释掉这段代码。
另外如果开启了HTTPS,同理需要修改HTTPS对应的配置文件。

修改完成后,重启服务器:

参考链接


script not found or unable to stat: /usr/lib/cgi-bin/php-cgi

RTSP回放时如何通过RTP的timestamp计算NPT时间(Normal Play Time)

客户端通过RTSPPLAY方法开始播放、定位播放、快速/慢速播放(Scale)某非实时视频时,客户端会通过Range头字段指定NPT时间,即让服务器开始从NPT指定时刻开始播放视频(NPTNormal Play Time---正常播放时间)即播放位置离文件开始部分的相对时间)。

播放开始后,下一次发送PLAY命令前,客户端需要根据服务器发来的RTP timestamp计算当前收到的帧的NPT时间。

客户端与服务器同步NPT时间

客户端可以在每次收到PLAY响应消息时与服务器同步NPT时间,响应消息里可带RTP-Info:rtptimeRange:npt参数。

客户端发往服务器RTSP消息例子:

服务器响应消息的例子:

其中响应消息中Range:npt的第一个参数表示客户端紧接着收到的timestampRTP-Info:rtptime指定的RTP包时的NPT时间。

当前NPT时间计算公式

其中各项含义:

  • begin_npt: PLAY返回消息里Range: npt=18.8-3600中的开始时间(秒)timestamp_len: RTP timestamp的最大表示个数,4个字节,所以是2^320x100000000
  • reset_counter: RTP timestamp的归零次数
  • current_timestamp: 当前收到的RTPtimestamp
  • start_timestamp: PLAY返回消息里的RTP-Info里的rtptime(指明此后第一个收到的RTP包的timestamp值)
  • clock_rate: 时钟频率,即SDP a=rtpmap:96 H264/90000里的90000
  • scale: PLAY里请求和返回中的Scale值(以返回为准)

NPTRTP timestamp的进一步讨论

RTPtimestamp里的wallclock应该是表示RTP会话开始到当前的绝对elapsed时间,与NPT不是对应的。(比如PAUSE以后,重新PLAYNPT是影片开始的相对时间,而RTP timestampRTP会话开始的相对时间)

加速播放时(RTSP scale=2),在PLAY返回让nptrtptime映射后,npt计算时要加倍计算,而rtptime间隔保持不变。

另外,关于RTP timestamp与帧率等关系可参考RTP timestamp与帧率及时钟频率的关系

参考资料

[1] RFC2326 (Appendix B: Interaction with RTP):

For scaling (see Section 12.34), RTP timestamps should correspond to
the playback timing. For example, when playing video recorded at 30
frames/second at a scale of two and speed (Section 12.35) of one, the
server would drop every second frame to maintain and deliver video
packets with the normal timestamp spacing of 3,000 per frame, but NPT
would increase by 1/15 second for each video frame.The client can maintain a correct display of NPT by noting the RTP
timestamp value of the first packet arriving after repositioning. The
sequence parameter of the RTP-Info (Section 12.33) header provides
the first sequence number of the next segment.[2] 3GPP 26.234 (A.3.2.4 Timestamp handling after PAUSE/PLAY requests):

The description below intends to clarify how RTP timestamps are specified within the 3GPP PSS when a client sends a PLAY request following a PAUSE request. The RTP timestamp space must be continuous along time during a session and then reflect the actual time elapsed since the beginning of the session. A server must reflect the actual time interval elapsed between the last RTP packets sent before the reception of the PAUSE request and the first RTP packets sent after the reception of the PLAY request in the RTP timestamp. A client will need to compute the mapping between NPT time and RTP timestamp each time it receives a PLAY response for on-demand content. This means that a client must be able to cope with any gap in RTP timestamps after a PLAY request.

The PLAY request can include a Range header if the client wants to seek backward or forward in the media, or without a Range header if the client only wants to resume the paused session.

Example:
In this example Client C plays a media file from Server S. RTP timestamp rate in this example is 1000Hz for clarity.

C -> S: PLAY rtsp://example.com/mediastream RTSP/1.0
CSeq: 2
Session: 123456
Range: npt=1.125-

S -> C: RTSP/1.0 200 OK
CSeq: 2
Session: 123456
Range: npt=1.120-
RTP-Info: url=rtsp://example.com/mediastream;seq=1000;rtptime=5000

S -> C: RTP packet - seq = 1000 - rtptime = 5000 - corresponding media time (NPT time) = 1120ms
S -> C: RTP packet - seq = 1001 - rtptime = 5040 - corresponding media time (NPT time) = 1160ms
S -> C: RTP packet - seq = 1002 - rtptime = 5080 - corresponding media time (NPT time) = 1200ms
S -> C: RTP packet - seq = 1003 - rtptime = 5120 - corresponding media time (NPT time) = 1240ms

C -> S: PAUSE rtsp://example.com/mediastream RTSP/1.0
CSeq: 3
Session: 123456

S -> C: RTSP/1.0 200 OK
CSeq: 3
Session: 123456

[10 seconds elapsed]

C -> S: PLAY rtsp://example.com/mediastream RTSP/1.0
CSeq: 4
Session: 123456

S -> C: RTSP/1.0 200 OK
CSeq: 4
Session: 123456
Range: npt=1.280-
RTP-Info: url=rtsp://example.com/mediastream;seq=1004;rtptime=15160

S -> C: RTP packet - seq = 1004 - rtptime = 15160 - corresponding media time (NPT time) = 1280ms
S -> C: RTP packet - seq = 1005 - rtptime = 15200 - corresponding media time (NPT time) = 1320ms
S -> C: RTP packet - seq = 1006 - rtptime = 15240 - corresponding media time (NPT time) = 1360ms

C -> S: PAUSE rtsp://example.com/mediastream RTSP/1.0
CSeq: 5
Session: 123456

S -> C: RTSP/1.0 200 OK
CSeq: 5
Session: 123456

C -> S: PLAY rtsp://example.com/mediastream RTSP/1.0
CSeq: 6
Session: 123456
Range: npt=0.5-

[55 milliseconds elapsed during request processing]

S -> C: RTSP/1.0 200 OK
CSeq: 6
Session: 123456
Range: npt=0.480-
RTP-Info: url=rtsp://example.com/mediastream;seq=1007;rtptime=15295

S -> C: RTP packet - seq = 1007 - rtptime = 15295 - corresponding media time (NPT time) = 480ms
S -> C: RTP packet - seq = 1008 - rtptime = 15335 - corresponding media time (NPT time) = 520ms
S -> C: RTP packet - seq = 1009 - rtptime = 15375 - corresponding media time (NPT time) = 560ms

参考链接